Diagnostic tests
Moving beyond sensitivity and specificity: using likelihood ratios to help interpret diagnostic tests
- John Attia
- Aust Prescr 2003;26:111-13
- 1 October 2003
- DOI: 10.18773/austprescr.2003.082
Properties of diagnostic tests have traditionally been described using sensitivity, specificity, and positive and negative predictive values. These measures, however, reflect population characteristics and do not easily translate to individual patients. Likelihood ratios are a more practical way of making sense of diagnostic test results and have immediate clinical relevance. In general a useful test provides a high positive likelihood ratio and a small negative likelihood ratio.
In clinical practice, physicians are often faced with interpreting the results of diagnostic tests. These results are not absolute. A negative test does not always rule out disease and some positive results can be false. As the prevalence of disease varies, the results of a test may have different implications; haematuria is more likely to be a sign of cancer in an elderly man than it is in a young woman.
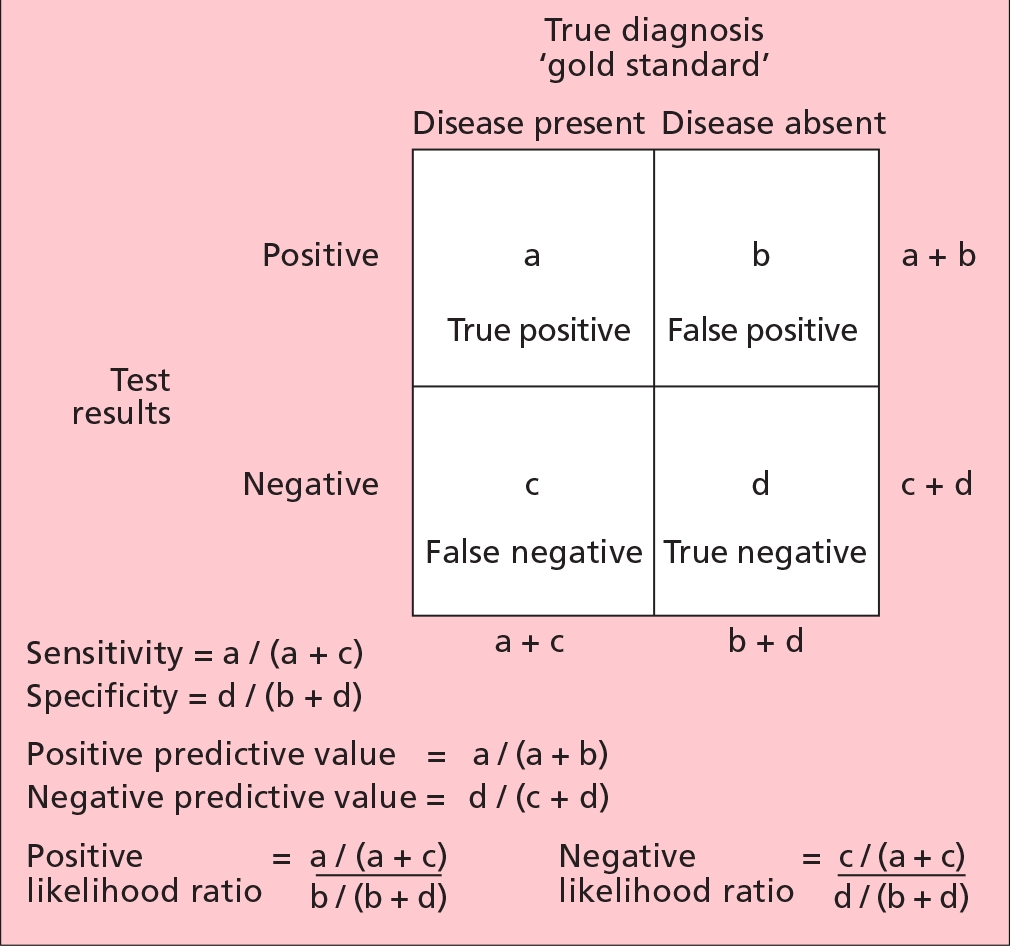
Clinical epidemiology has long focused on sensitivity and specificity, as well as positive and negative predictive values, as a way of measuring the diagnostic utility of a test.1The test is compared against a reference ('gold') standard, and results are tabulated in a 2 x 2 table (Fig. 1). Sensitivity is the proportion of those with disease who test positive. Another way of saying this is that sensitivity is a measure of how well the test detects disease when it is really there; a sensitive test has few false negatives. Specificity is the proportion of those without disease who test negative. It measures how well the test rules out disease when it is really absent; a specific test has few false positives.
Although well established, sensitivity and specificity have some deficiencies in clinical use. This arises mainly from the fact that sensitivity and specificity are population measures, i.e. they summarise the characteristics of the test over a population.
How do we interpret results for an individual patient? What is the probability of disease in a 50-year-old male with suspected angina who has more than 1 mm of ST segment depression during an exercise stress test? What does a negative d-dimer test mean, in terms of the chance of having a deep vein thrombosis, for a 40-year-old female with a swollen calf? It is impossible for the clinician to know whether the positive result is a true positive or a false positive; or whether the negative result is a true negative or a false negative.
What clinicians need is a measure that combines the true and false positives (or negatives) into one. The positive predictive value was such an attempt; it expresses the proportion of those with positive test results who truly have disease (Fig. 1). Another way of saying this is, given that a patient tests positive, what is the probability that they truly have disease? However, this measure is critically dependent on the population chosen and the prevalence of disease. The test performs less well the lower the prevalence. The same caveats are applicable to the negative predictive value. This means that the positive predictive value and negative predictive value are not transferable from one patient to another, or from one setting to another.
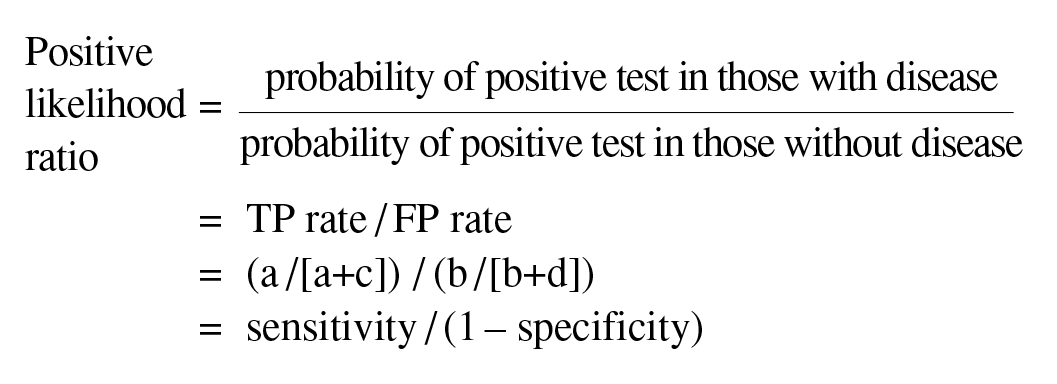
Likelihood ratios are independent of disease prevalence. They may be understood using the following analogy. Assume that a patient tests positive on a diagnostic test; if this were a perfect test, it would mean that the patient would certainly have the disease (true positive). The only thing that stops us from making this conclusion is that some patients without disease also test positive (false positive). We therefore have to correct the true positive (TP) rate by the false positive (FP) rate; this is done mathematically by dividing one by the other (Fig. 1).
Algebraically we can show that:
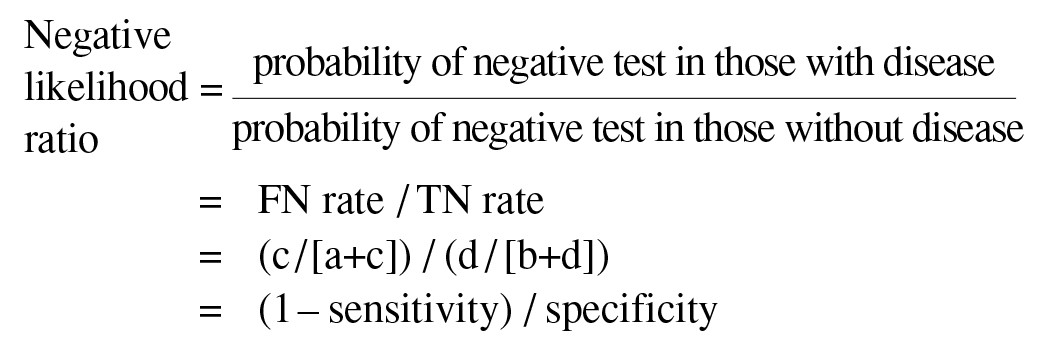
Likewise, if a patient tests negative, we are still worried about the likelihood of this being a false negative (FN) rather than a true negative (TN). This likelihood is given mathematically by the probability of a negative test in those with disease, compared to the probability of a negative test in those without disease.
Likelihood ratios have a number of useful properties:
The interpretation of likelihood ratios is intuitive: the larger the positive likelihood ratio, the greater the likelihood of disease; the smaller the negative likelihood ratio, the lesser the likelihood of disease.
To see how likelihood ratios work, let us take the example of the 50-year-old male with the positive stress test. It is known that a more than 1 mm depression on exercise stress testing has a sensitivity and specificity of 65% and 89% respectively for coronary artery disease when compared to the reference standard of angiography.2This means that:
Positive likelihood ratio = 0.65/(1-0.89) = 5.9
The likelihood of this patient having disease has increased by approximately six-fold given the positive test result. To translate this into a probability of disease one must use Bayes' Theorem.*
Bayes' Theorem states that the pre-test odds of disease multiplied by the likelihood ratio yields the post-test odds of disease. Note that because of the theorem's mathematical properties, the likelihood ratios must be used with odds rather than per cent probability of disease. To avoid the bother of converting fractions to odds, multiplying by the odds ratio, getting the post-test odds and converting back to a fraction, the Bayes' nomogram is used (Fig. 2).3In this nomogram, the pre-test probability is located on the first axis, and joined to the likelihood ratio, on the second axis, to read off the post-test probability on the third axis.
Pre-test probability is located on the first axis and joined to the appropriate likelihood ratio on the second axis. The post-test probability is then read off the third axis.
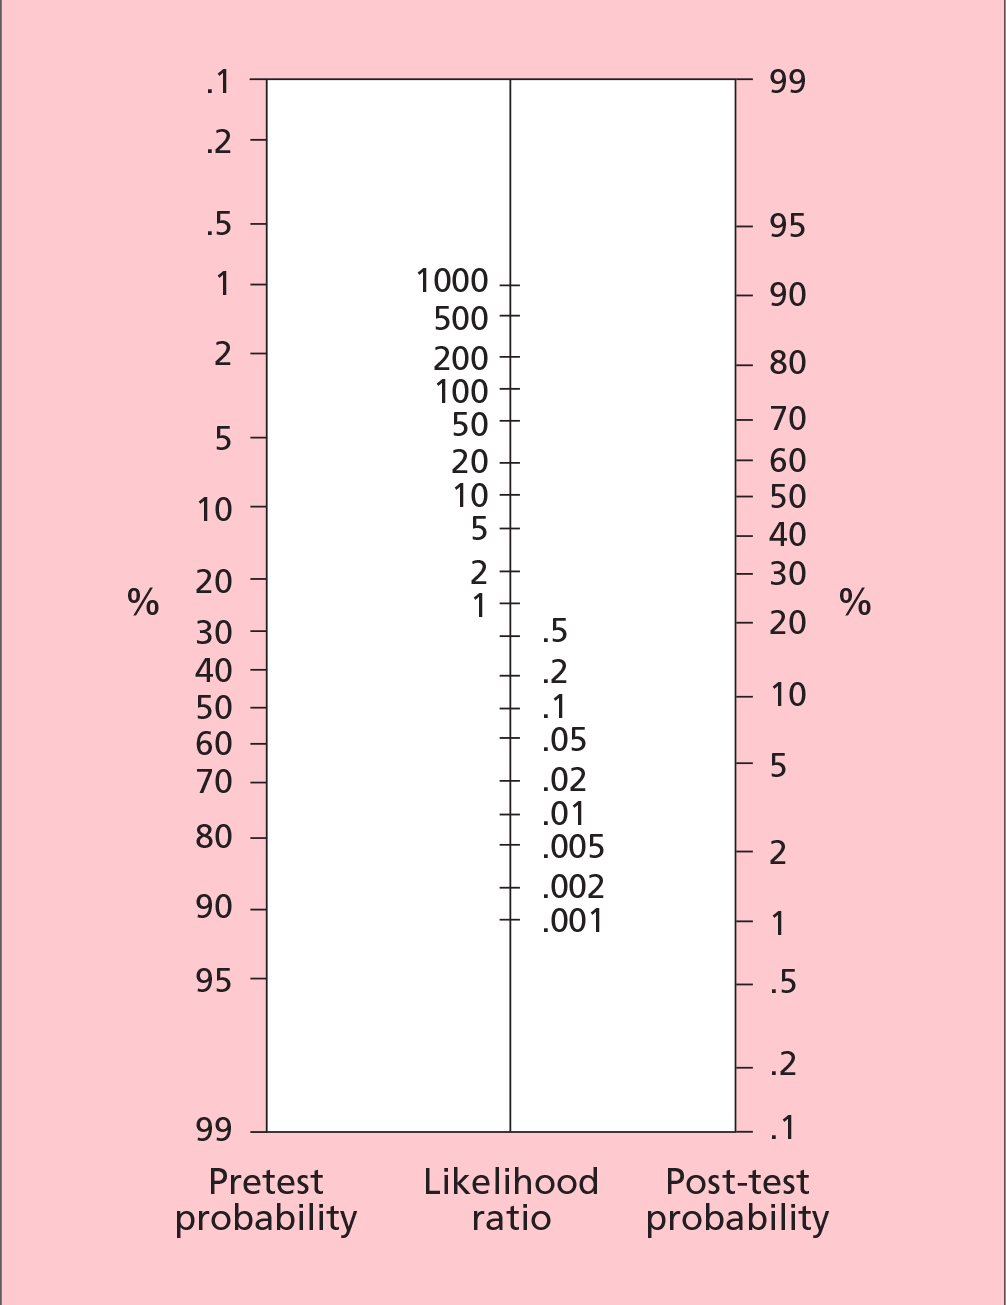
For example, if we estimate from our clinical assessment that the 50-year-old male has a 40% chance of having coronary artery disease, we join 40% on the first axis with 6 on the second axis and read off the post-test probability of 80%, i.e. the patient has an 80% chance of having coronary artery disease given the positive test result.
Likewise, let us estimate that the 40-year-old woman has a 17% chance of having a deep vein thrombosis. A d-dimer test has a sensitivity of 89% and a specificity of 77%. This means that:
Negative likelihood ratio = (1-0.89)/0.77 = 0.14
Using Bayes' nomogram, and joining 17% with 0.14, we read off a post-test probability of approximately 3%. This means that after a negative test the woman has a 3% chance of having a deep vein thrombosis.
It is important to note that likelihood ratios always refer to the likelihood of having disease; the positive and negative designation simply refers to the test result. Hence the interpretation of the post-test odds is always a likelihood of having disease.
These scenarios highlight some additional advantages of using likelihood ratios. They enable the clinician to talk quantitatively about the risk of disease which may allow more informed decision making on the part of the patient. Likelihood ratios emphasise the reality that we are never 100% sure of the diagnosis. Rather than looking at diagnostic tests as a yes or no answer to the question of whether a patient has disease, it makes us realise that positive or negative results simply increase or decrease the likelihood of disease, judged on the basis of our history and physical examination. Various items of the history and examination can be seen as diagnostic tests, and can have likelihood ratios associated with them.
Although likelihood ratios are clinically very useful, a significant barrier to using them in routine practice is the amount of time required to do literature searching, in order to identify the sensitivity and specificity of the tests. Fortunately, as their use is increasing, authors have compiled likelihood ratios for common tests.4, 5
The Bayes' nomogram requires an estimation of the probability of disease. There are two methods of estimating the pre-test probability:
Clinical decision rules have been published for a small number of clinical problems. For example, based on three questions regarding the quality of chest pain, clinicians can estimate the pre-test probability of coronary artery disease.2Likewise, various signs and symptoms can be given a point score to arrive at a pre-test probability of deep vein thrombosis6(Table 1). Unfortunately, such decision rules are rare, and difficult to find, although they have recently been compiled in a book.7
Table 1 - Clinical decision rule for deep vein thrombosis
| Clinical feature | Score |
| Active cancer | 1 |
| Paralysis, paresis or recent plaster | 1 |
| Bedridden for more than three days or major surgery within four weeks | 1 |
| Localised tenderness | 1 |
| Entire leg swollen | 1 |
| Calf swelling more than 3 cm | 1 |
| Pitting oedema | 1 |
| Collateral superficial veins | 1 |
| Alternative diagnosis as likely as or greater than that of deep vein thrombosis | -2 |
A score is given for the presence of certain clinical features. The total score reflects the probability of having a deep vein thrombosis.
< 0 is low probability (3%)
1–2 is moderate (17%)
> 3 is high (75%)
Likelihood ratios are a useful and practical way of expressing the power of diagnostic tests in increasing or decreasing the likelihood of disease. Unlike sensitivity and specificity, which are population characteristics, likelihood ratios can be used at the individual patient level. Using likelihood ratios and Bayes' nomogram allows us to convert a pre-test probability, based on an educated guess or a clinical decision rule, to a post-test probability.
* Bayes' Theorem is available electronically at various evidence-based medicine web sites, e.g.
http://www.cebm.net/nomogram.asp (for nomogram)
http://www.health.usyd.edu.au/resources/ebm/bayestxt.htm (for calculator)
Senior Lecturer, Clinical Epidemiology, Centre for Clinical Epidemiology and Biostatistics Australia, University of Newcastle, Newcastle, New South Wales
