Practice Review – Revisiting treatment options: Neuropathic pain
Australian GPs recently received a Practice Review on prescribing for neuropathic pain. Find out more about how to read your practice review.
Key points
- Find more information to help you interpret and understand your data
- Access a sample report
- Reflect on your data in relation to your patients and their indications for amitriptyline and pregabalin
Download and print a sample report
About the Practice Review
The Practice Review is a four-page report regularly mailed to GPs in Australia. Its purpose is to support you in your professional development and quality improvement. Each report focuses on a specific clinical area and includes:
- background information around the clinical area of focus
- your individual dispensing data for PBS medicines or utilisation of MBS tests
- evidence-based points for reflection
- aggregate data of GPs working in similar practices across Australia for comparison
- additional insights from the MedicineInsight general practice database to help you interpret your graphs in the context of your own clinical practice
How has your prescribing of amitriptyline and pregabalin changed over time?
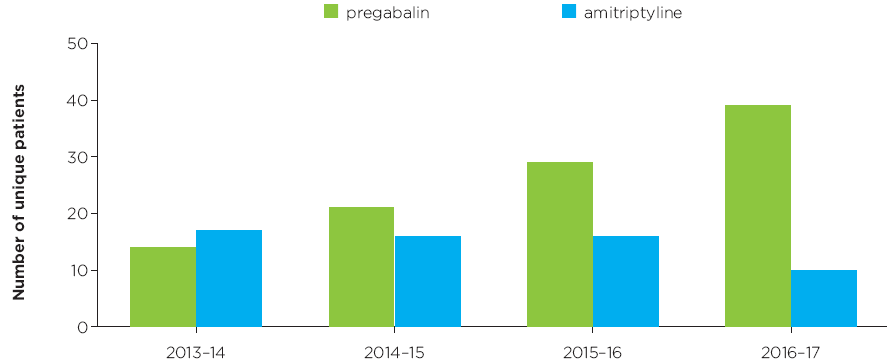
Figure 1
Read an accessible version of Figure 1
What does this graph show me?
- This graph shows the total number of patients who had amitriptyline or pregabalin dispensed for them from a prescription that you wrote.
- Data are shown for prescriptions dispensed in the financial years 2013–14, 2014–15, 2015–16 and 2016–17.
- If a patient had both amitriptyline AND pregabalin dispensed for them in a particular year, then they are counted once in each medicine group.
- The purpose of this graph is to show you a trend in your prescribing of amitriptyline and pregabalin over time.
I have an asterisk on my graph, what does this mean?
- An asterisk on a column in the graph indicates that your data for that medicine are above the range that can be represented in the graph.
- Graphs are scaled to fit 90% of the data from all GPs.
What does MedicineInsight tell us?
- Aggregate MedicineInsight data as at 1 January 2018.
- Patients are included if they have used, or are currently using, pregabalin in the 24 months prior to this date.
- Patients with epilepsy without concurrent neuropathic pain are excluded.
How many of your patients using low-dose amitriptyline have neuropathic pain?
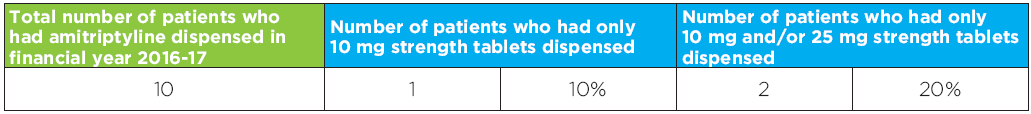
Figure 2
Read an accessible version of Figure 2
What does this table show me?
- This table shows the total number of your patients who were using amitriptyline in the financial year 2016–17.
- Of these patients, the total number and percentage of patients using only amitriptyline 10 mg (and no amitriptyline 25 mg or 50 mg) and the total number and percentage of patients using of patients using only 10 mg and/or 25 mg (and no amitriptyline 50 mg) is shown.
- The number of patients using amitriptyline 50 mg is not shown, but can be calculated by subtracting the number of patients who had only 10 mg and/or 25 mg strength tablets dispensed from the total number of patients who had amitriptyline dispensed in 2016–17.
- The purpose of this graph is provide you with a snapshot of your prescribing of the lower strengths of amitriptyline, and allow you to consider whether these patients have neuropathic pain.
- Be aware that the graph shows the strength of amitriptyline patients are using, which may not reflect their prescribed daily dose.
What does MedicineInsight tell us?
- Aggregate MedicineInsight data as at 1 January 2018.
- Patients are included if they are currently using amitriptyline and did not have a recorded diagnosis of depression in the 24 months prior to 1 January 2018.
What strength of pregabalin do you prescribe for your patients?
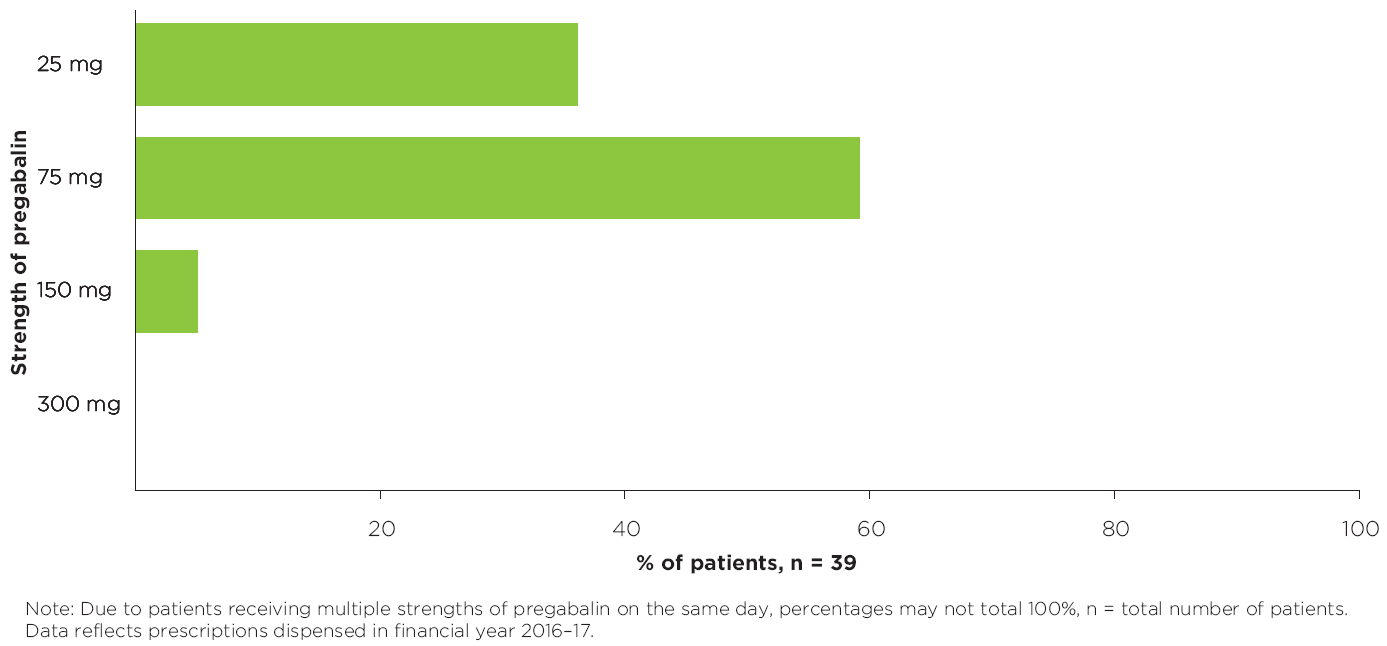
Figure 3
Read an accessible version of Figure 3
What does this graph show me?
- This graph shows the percentage of patients who received pregabalin in strengths of 25 mg, 75 mg, 150 mg or 300 mg in the financial year 2016–17, from a prescription you wrote.
- Detail from the most recent pregabalin prescription dispensed to the patient is captured in the graph. This may not reflect their prescribed daily dose.
- Patients who received multiple strengths of pregabalin on the same day will be captured once in each of those strengths, therefore percentages may not total 100%.
- The purpose of this graph is to provide you a snapshot of the strengths of pregabalin your patients are currently using.
- The total number of your patients who started pregabalin treatment in 2016–17 is shown in the point for reflection above.
- This number is also expressed as a percentage of the total number of your patients who are using pregabalin in 2016–17.
- The number of patients who started with 25 mg strength tablets and the number of patients who started with 75 mg tablets is also provided.
- A patient is considered to have started pregabalin treatment if they had a first prescription for pregabalin in 2016–17 and they did not have a prescription for pregabalin in the 12 months prior to the date of this first prescription.
- The strength of pregabalin prescribed in this first prescription is used for the data.
- This data may give you an indication of the strength of pregabalin that you usually prescribe when you initiate pregabalin treatment.
My numbers do not look as I’d expect, why might this be?
You may have patients using combination strengths of pregabalin, however only the strength recorded on the prescription dispensed most recently will be included in the graph.
For example, you may have a patient using both 75 mg and 150 mg of pregabalin. If the date of supply of pregabalin 75 mg was 1 June 2017, and the date of supply of pregabalin 150 mg was 30 June 2017, then this patient would be included in in the graph as having received 150 mg pregabalin.
How adherent are your patients to pregabalin treatment?
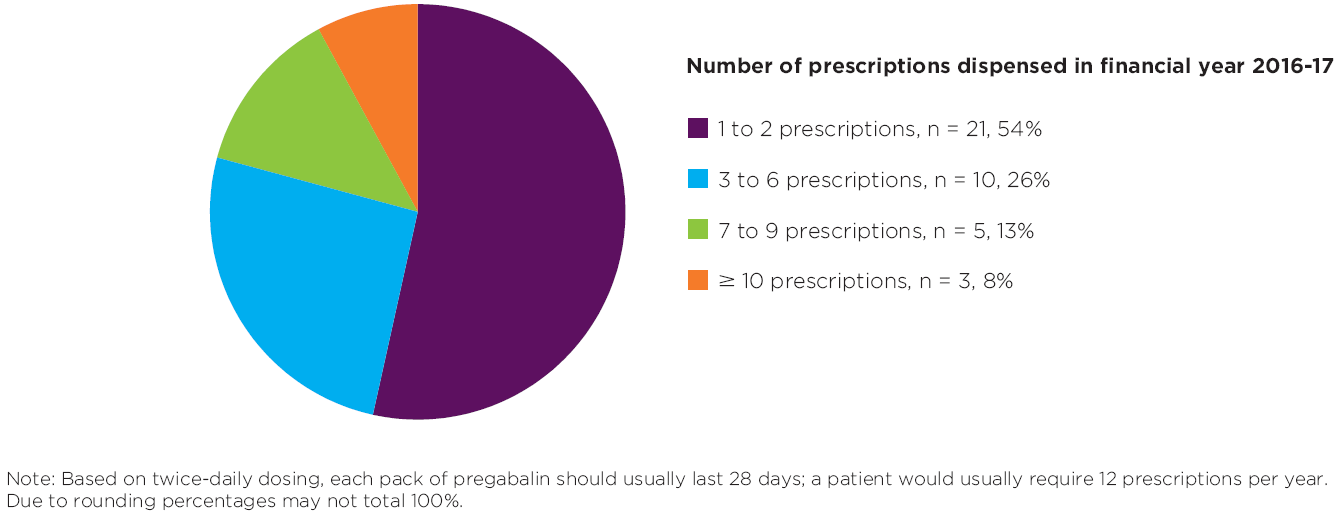
Figure 4
Read an accessible version of Figure 4
What does this graph show me?
- For all your patients using pregabalin in the financial year 2016–17, this graph shows the number and percentage of patients who had 1 to 2, 3 to 6, 7 to 9 or ≥ 10 prescriptions dispensed.
- The purpose of this graph is to provide you with a snapshot of your patients’ possible adherence to pregabalin treatment.
My numbers do not look as I’d expect, why might this be?
You will probably have a mix of patients who:
- are using ongoing, twice-daily pregabalin treatment and would usually require ≥ 10 prescriptions (including repeats) per year – probably the majority of your patients.
- started pregabalin treatment in the financial year 2016–17 and may have had fewer pregabalin prescriptions dispensed depending on their starting date – probably a small group of your patients.
- are splitting their dose by using a combination strengths and may require fewer pregabalin prescriptions in a year.
- are not getting their pregabalin prescriptions dispensed.
Age profile of your patients
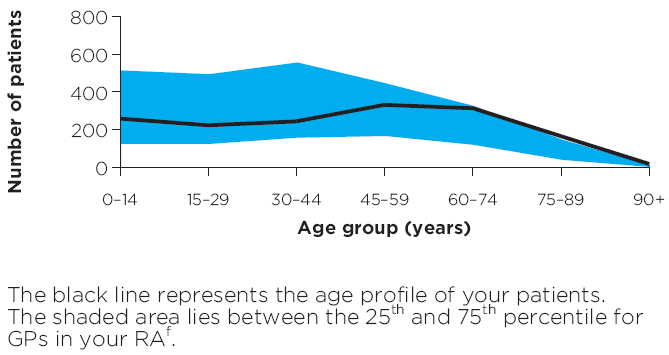
Figure 5
Read an accessible of Figure 5
What does this graph show me?
- This graph shows the breakdown by age group of your total number of patients who received a category 1 Medicare consultation between 1 July 2016 and 30 June 2017.
- The purpose of this graph is to give you a snapshot of your patients to help you interpret your data.
- The shaded blue area lies between the 25th and 75th percentile for the age profiles of patients of GP practices in your RA.
- Your RA peer group is identified.
I have an asterisk on my graph. What does this mean?
An asterisk on the age profile graph indicates that your data is above the range that can be represented in the graph, ie, you have more than 800 patients in the age group above which the asterisk has been placed.
Your Medicare patients and concession card holders
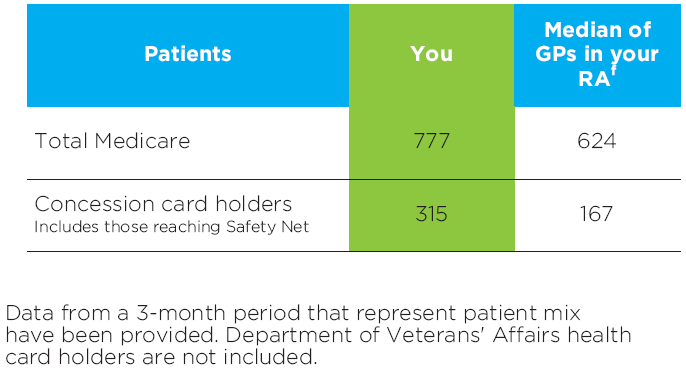
Figure 6
Read an accessible version of Figure 6
What does this table show me?
- The table shows the total number of patients who received a category 1 Medicare consultation, and the total number of patients who used a concession card or safety net card to have a prescription written by you dispensed.
- The purpose of this table is to provide you with a snapshot of your patients to help you interpret some of the data presented in the graphs and tables in this report.
- This information is from 1 April 2017 to 30 June 2017.
- The median for GPs in your RA is also provided.
Frequently asked questions
Find out more
- Find out more about our national program: Neuropathic pain, and access a range of clinical tools and patients resources as well as CPD activities
- Review your patients and your practice in our Clinical e-Audit – Neuropathic pain: a roadmap for diagnosis and management.
- Read the MedicineWise News: Neuropathic pain: diagnosis and treatment today
References
- Drug utilisation sub-committee. Pregabalin: 24 month predicted versus actual analysis (October 2015). Canberra: DUSC, 2015 (accessed 2 November 2017).
- Vinas-Bastart M, Oms-Arias M, Pedraza-Gutierrez A, et al. Clinical use of pregabalin in general practice in Catalonia, Spain: a population-based cross-sectional study. Pain Med 2017.
- Wettermark B, Brandt L, Kieler H, et al. Pregabalin is increasingly prescribed for neuropathic pain, generalised anxiety disorder and epilepsy but many patients discontinue treatment. Int J Clin Pract 2014;68:104-10.
- Shanthanna H, Gilron I, Rajarathinam M, et al. Benefits and safety of gabapentinoids in chronic low back pain: A systematic review and meta-analysis of randomized controlled trials. PLoS Med 2017;14:e1002369.
- Evoy KE, Morrison MD, Saklad SR. Abuse and misuse of pregabalin and gabapentin. Drugs 2017;77:403-26.
- Finnerup NB, Attal N, Haroutounian S, et al. Pharmacotherapy for neuropathic pain in adults: a systematic review and meta-analysis. Lancet Neurol 2015;14:162-73.
- Haanp\u00e4\u00e4 ML, Backonja MM, Bennett MI, et al. Assessment of neuropathic pain in primary care. Am J Med 2009;122:S13-21.
- Finnerup NB, Haroutounian S, Kamerman P, et al. Neuropathic pain: an updated grading system for research and clinical practice. Pain 2016;157:1599-606.
- Moulin D, Boulanger A, Clark AJ. Pharmacological management of chronic neuropathic pain - revised consensus statement from Canadian Pain Society. Pain Res Manag 2014;19
- Neurology Expert Group. Therapeutic Guidelines. Melbourne: Therapeutic Guidelines Limited, 2011 (accessed 2 November 2017).
- Dworkin RH, O'Connor AB, Backonja M, et al. Pharmacologic management of neuropathic pain: evidence-based recommendations. Pain 2007;132:237-51.
- National Institute for Health and Care Excellence (NICE). Neuropathic pain in adults: pharmacological management in nonspecialist settings. Clinical guidance (CG) 173. UK: 2013 (updated 2014) (accessed 1 September 2017).
- Moore RA, Derry S, Aldington D, et al. Amitriptyline for neuropathic pain in adults. Cochrane Database Syst Rev 2015:CD008242.
- Pfizer. Lyrica (pregabalin) Product Information. Pfizer Pty Ltd, 2017 (accessed 13 December 2017).
- Australian Medicines Handbook. Neurological drugs. Adelaide: AMH Pty Ltd, 2016 (accessed 2 November 2017).
- Serpell M, Latymer M, Almas M, et al. Neuropathic pain responds better to increased doses of pregabalin: an in-depth analysis of flexible-dose clinical trials. J Pain Res 2017;10:1769-76.
- Streckmann F, Zopf EM, Lehmann HC, et al. Exercise intervention studies in patients with peripheral neuropathy: a systematic review. Sports Med 2014;44:1289-304.
- Turk DC, Audette J, Levy RM, et al. Assessment and treatment of psychosocial comorbidities in patients with neuropathic pain. Mayo Clin Proc 2010;85:S42-50.
- Treede RD, Jensen TS, Campbell JN, et al. Neuropathic pain: redefinition and a grading system for clinical and research purposes. Neurology 2008;70:1630-5.
- Jensen TS, Baron R, Haanp\u00e4\u00e4 M, et al. A new definition of neuropathic pain. Pain 2011;152:2204-5.