Practice Review – GORD: Stepping down PPIs
Australian GPs recently received a Practice Review on prescribing for GORD. Find out more about how to read your practice review.
Key points
- Reflect on your practice and prescribing patterns for PPIs and GORD.
- Reflect on your data in relation to your patients and their indications for PPIs
- Access a sample report.
About the Practice Review
The Practice Review is a four-page report regularly mailed to GPs in Australia. Its purpose is to support you in your professional development and quality improvement. Each report focuses on a specific clinical area and includes:
- background information about the clinical area of focus
- your individual dispensing data for PBS medicines or utilisation of MBS tests
- evidence-based points for reflection
- aggregate data of GPs working in similar practices across Australia for comparison
- additional insights from the MedicineInsight general practice database to help you interpret your graphs in the context of your own clinical practice.
Download and print a sample report
How has your prescribing of PPIs changed over time?
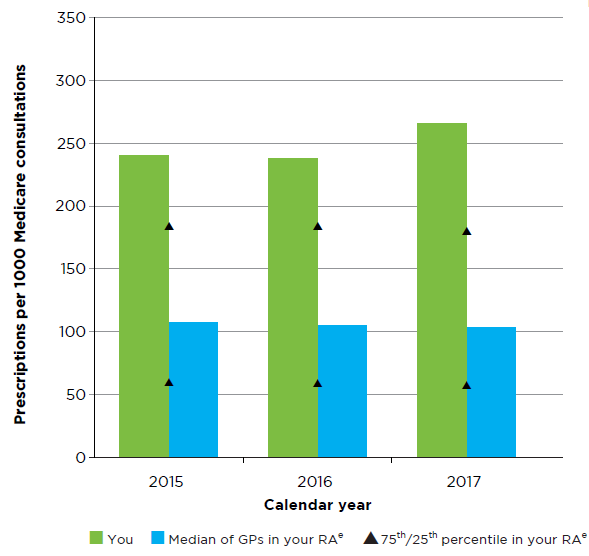
- How does this data compare to your estimate of patients using a PPI for GORD?
- Aggregate MedicineInsight data as at 1 May 2018.
- PPI use and reference to relevant indication must be in the 24 months before 1 May 2018
What is the cost of your PPI prescribing?
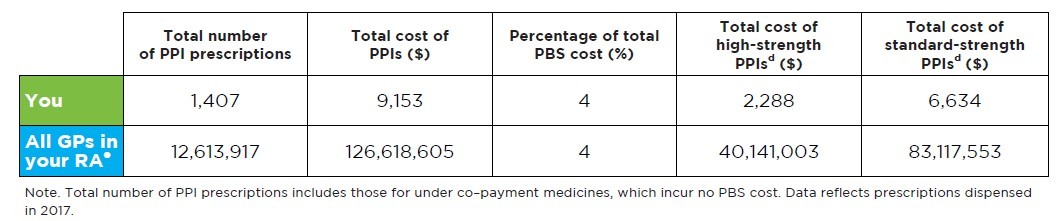
Read an accessible version of Table 1
What does this table show me?
- This table shows:
- the total number of PPI prescriptions that you wrote that were dispensed
- the total cost of the PPI prescriptions you wrote that were dispensed
- the total cost of your PPI prescriptions as a percentage of your total PBS cost
- the total cost of all high-strength PPI prescriptions (ie, esomeprazole 40 mg) that you wrote that were dispensed
- the total cost of all standard-strength PPI prescriptions (ie, esomeprazole 20 mg, lansoprazole 30 mg, omeprazole 20 mg, pantoprazole 40 mg and rabeprazole 20 mg) that you wrote that were dispensed.
- Data for all GPs in your RA is also provided to help you reflect on your prescribing
- The table is based on medicines dispensed in calendar year 2017
- The total cost of low-strength PPI prescriptions is not shown but can be calculated by subtracting the total cost of high-strength PPIs and standard-strength PPIs from the total cost of PPI prescriptions.
- The purpose of this graph is to provide you with a snapshot of your prescribing of PPIs in 2017 and allow you to consider this in relation to your patients.
My numbers do not look as I’d expect, why could this be?
- The table shows the total number of PPI prescriptions which includes both over co-payment and under co-payment medicines. Under co-payment medicines incur no cost to the PBS as the patient pays the full cost.
- If you prescribe many under co-payment medicines, then the cost associated with your prescribing will be proportionately lower than you may expect.
Help me interpret and reflect on my data
- Am I reserving high strength PPIs for GORD symptoms that are inadequately controlled with standard dose?
- Do I step down PPI treatment to a low-strength PPI or stop after the initial 4-8 weeks of treatment?
How many prescriptions do you supply to your patients?
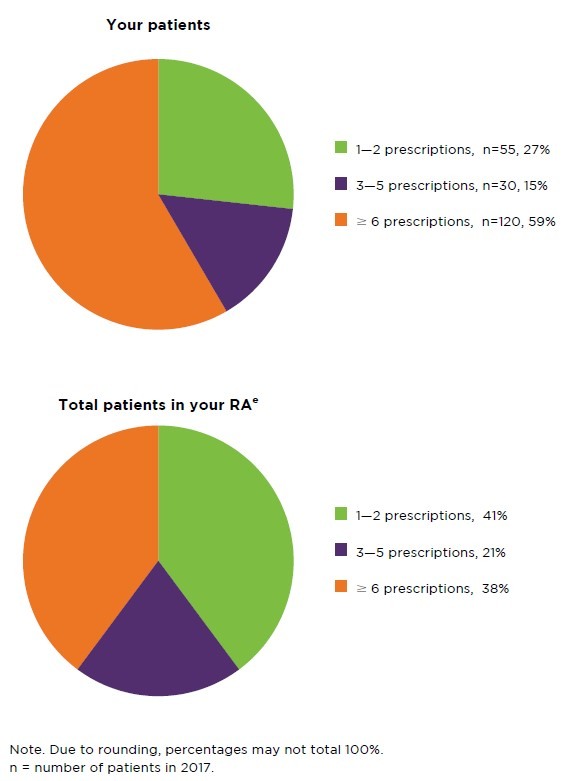
Figure 2
Read an accessible version of Figure 2
What does this pie chart show me?
- This pie chart shows the percentages of patients who had 1 to 2, 3 to 5 or ≥ 6 prescriptions dispensed in calendar year 2017, from prescriptions that you wrote.
- RA data is provided for comparison with your peers. Here, the total number of patients who had 1 to 2, 3 to 5 or ≥ 6 prescriptions dispensed in calendar year 2017 is expressed as a percentage of the total number of patients using PPIs in your RA.
- Due to rounding, percentages may not total 100%
- The purpose of this graph is to provide you with a snapshot of how long your patients remain on PPI treatment based on your prescribing, compared to your peers.
In calendar year 2017, n of your patients started PPI treatment.
- A patient is considered to have started PPI treatment if they had a first prescription for a PPI medicine dispensed in calendar year 2017 and they did not have a prescription for any PPI medicine in the 6 months before the date of this first prescription.
Help me interpret and reflect on my data
- How many patients did I start on PPI treatment for GORD in 2017? Did most of my patients start at the beginning of the year or the end of the year?
- How many repeats did I prescribe when starting PPI treatment for GORD?
- Of my patients who have ≥ 6 prescriptions, what proportion have an indication that requires long-term regular PPI treatment (eg, complicated GORD, Zollinger-Ellison syndrome)?
- What is my approach to patients who expect continued prescribing of a PPI for GORD?
What is your approach to stepping down?
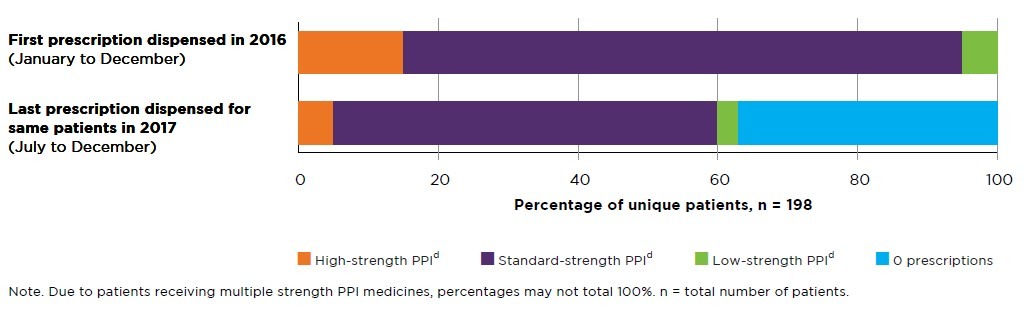
Figure 3
Read an accessible version of Figure 3
What does this graph show me?
- For all your patients who used a PPI in calendar year 2016, this graph shows the strength of PPI medicine they first used in 2016, and the strength of PPI medicine they are using a year later in 2017.
- The top side stacker bar shows the percentage of unique patients who had a high-strength, standard-strength or low-strength PPI dispensed as their first prescription in 2016.
- Following the same patients during the period July 2017 – September 2017, the percentage of unique patients who had a high-strength, standard-strength, low-strength PPI or no PPI medicine dispensed is shown in the bottom side stacker bar.
- The total number of unique patients for this graph is also provided.
- The purpose of this graph is to show you a prescribing trend as an indication of how many of your patients are stepping down PPI treatment.
- This data also shows the strength of PPI medicine that you usually prescribe when you initiate treatment.
My numbers do not look as I’d expect, why could this be?
- PPI medicines are grouped into different strengths as follows:
- High-strength PPI: esomeprazole 40 mg
- Standard-strength PPIs: esomeprazole 20 mg, lansoprazole 30 mg, omeprazole 20 mg, pantoprazole 40 mg, rabeprazole 20 mg
- Low strength PPIs: lansoprazole 15 mg, omeprazole 10 mg, pantoprazole 20 mg, rabeprazole 10 mg. - You may have patients who have had multiple strengths of PPI medicines dispensed on the same day. These patients may be counted in each of those strengths and therefore percentages may not total 100%.
For example, you may have a patient who had two prescriptions written by you, one for esomeprazole 20 mg and one for pantoprazole 20 mg. If both prescriptions were dispensed on 2 February 2016 (and this was the first prescription the patient had dispensed in 2016), then the patient would be included in the top side stacker bar as having received a first prescription of both standard-strength and low-strength PPI. - This data does not capture doses. For example, you may have patients using a standard strength twice daily (eg, esomeprazole 20mg twice daily) which is equivalent to high strength. Similarly, you may have patients using a standard strength in half daily doses or every second day. Please consider this when reflecting on your data.
What does MedicineInsight tell us?
- Aggregate MedicineInsight data as at 1 May 2018.
- PPI strengths grouping is as outlined above.
Help me interpret and reflect on my data
- What strength do I prescribe to my patients when starting treatment for GORD?
- How often do I review my patients with the view to stepping down or stopping PPI treatment?
- Could I be stepping down PPI treatment or stopping for more of my patients?
Age profile of your patients
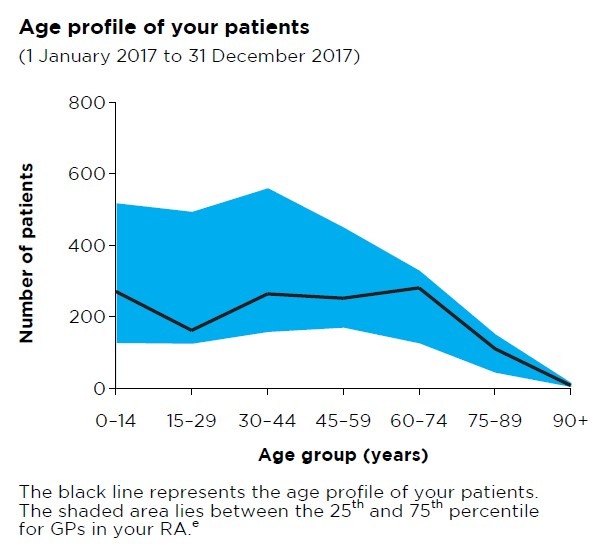
Read an accessible version of Figure 4
What does this graph show me?
- This graph shows the breakdown by age group of your total number of patients who received a category 1 Medicare consultation between 1 January 2017 and 31 December 2017.
- The purpose of this graph is to give you a snapshot of your patients to help you interpret your data.
- The shaded blue area lies between the 25th and 75th percentile for the age profiles of patients of GP practices in your RA.
- Your RA peer group is identified.
I have an asterisk on my graph. What does this mean?
- An asterisk on the age profile graph indicates that your data is above the range that can be represented in the graph, ie, you have more than 800 patients in the age group above which the asterisk has been placed.
- This graph is scaled to fit 90% of the data from all GPs.
Your Medicare patients and concession card holders
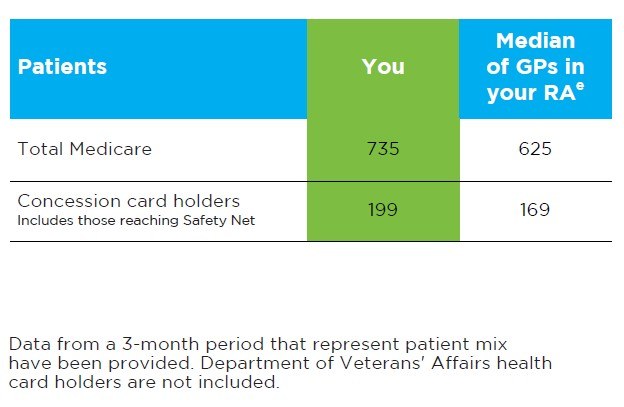
Read an accessible version of Table 2
What does this table show?
- This table shows the total number of unique patients that you have seen over a standard 3-month period.
- The table gives the total number of patients who received a category 1 Medicare consultation, and the total number of patients who used a concession card or safety net card to have a prescription written by you dispensed.
- The purpose of this table is to provide you with a snapshot of your patients to help you interpret some of the data presented in the graphs and tables in this report.
- This information is from 1 April 2017 to 30 June 2017.
- The median for GPs in your RA is also provided.
Frequently asked questions
I would like to know more
Find out more about our national program: Managing GORD with PPIs in primary care, and access a range of clinical tools and patients’ resources as well as CPD activities.
- Book an educational visit: Starting, stepping down and stopping medicines
- Review your patients and your practice in our Clinical e-Audit – PPIs in GORD: a stepped approach
- Read the Medicinewise News: Stepping the appropriate path with GORD medicines
- Access the case study: PPIs: reviewing treatment for gastro-oesophageal reflux disease
References
- Commonwealth of Australia. National Strategy for the Quality Use of Medicines Plain English edition. Canberra: Commonwealth of Australia, 2002 (accessed 5 February 2018).
- Primary Health Tasmania. A guide to deprescribing General Information. Tasmania: Primary Health Tasmania, 2016 (accessed 4 May 2018).
- Pharmaceutical Benefits Scheme. Expenditure and prescriptions twelve months to 30 June 2017. Canberra: Department of Human Services, 2017 (accessed 20 February 2018).
- Haastrup P, Paulsen MS, Begtrup LM, et al. Strategies for discontinuation of proton pump inhibitors: a systematic review. Fam Pract 2014;31:625-30.
- Gastrointestinal Expert Group. Therapeutic Guidelines: Disorders of the oesophagus. Melbourne: Therapeutic Guidelines Ltd, 2016 (accessed 6 February 2018).
- Gastroenterological Society of Australia. Gastro-oesophageal reflux disease in adults. Australia: GESA, 2011 (accessed 4 May 2018).
- Australian Medicines Handbook. Adelaide: AMH Pty Ltd, 2017 (accessed 6 February 2018).
- World Gastroenterology Organisation. Global perspective on gastroesophageal reflux disease. 2015 (accessed 4 May 2018).
- BMJ Publishing Group. Prescribing PPIs. Drug and Therapeutics Bulletin 2017;55:117-20
- Choosing Wisely Australia. Royal Australian College of General Practitioners: tests, treatments and procedures clinicians and consumers should question. Sydney: NPS MedicineWise, 2018 (accessed 4 May 2018).
- Lodrup AB, Reimer C, Bytzer P. Systematic review: symptoms of rebound acid hypersecretion following proton pump inhibitor treatment. Scand J Gastroenterol 2013;48:515-22.