Practice Review: Opioids prescribing in chronic non-cancer pain
Australian GPs recently received a Practice Review on opioids prescribing. Find out more about how to read your practice review.
Key points
- Reflect on your management of patients with chronic non-cancer pain who are prescribed opioids.
- Reflect on your data in relation to your patients and their individual circumstances, and management needs.
- Access a sample report.
Download and print a sample report
Updated 3 August 2020
About the Practice Review
The Practice Review is a four-page report regularly mailed to GPs in Australia. Its purpose is to support you in your professional development and quality improvement. Each report focuses on a specific clinical area and includes:
- background information about the clinical area of focus
- your individual data on the dispensing of PBS medicines you prescribed
- evidence-based points for reflection
- aggregate data of GPs working in similar remoteness area (RA) across Australia for comparison
- further insights from MedicineInsight to complement your individual PBS data.
Which opioids are part of the report?
Opioid medicines with PBS item codes for palliative care, opiate dependence or dental prescribing have not been included.
These data include both over and under co-payment prescriptions.
What should be considered when interpreting the data?
- The indication for prescribing cannot be determined from PBS data.
For example:
If you prescribe opioids for patients with cancer or acute pain or for palliative care (for example by selecting a PBS item code corresponding to severe disabling pain), your overall prescribing captured in this report will be higher than you may expect in relation to your patients with chronic non-cancer pain. - All practices are different and practices specialising in palliative care, cancer care or acute care may have higher appropriate utilisation rates.
- The report includes dispensing data, (ie, opioids prescribed by you that were dispensed) and the time periods shown apply to the date of dispensing.
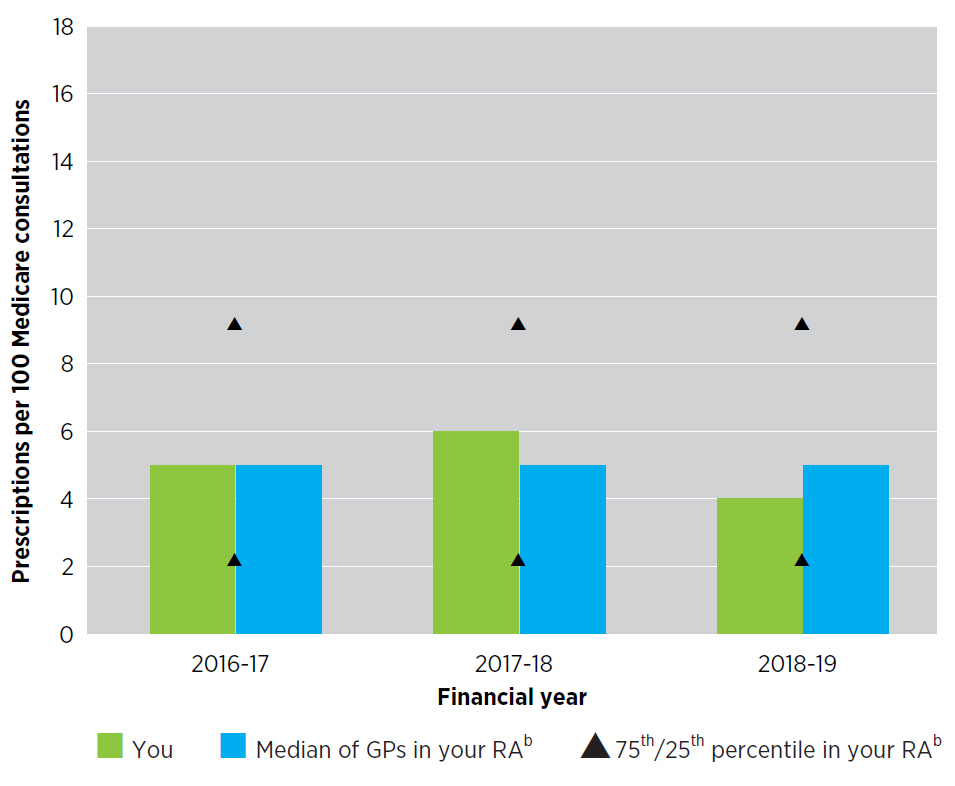
How has your prescribing of opioids changed over time?
Read an accessible text version of this graph
What does this graph show me?
- This graph shows the total number of opioid prescriptions that you prescribed and that were dispensed, expressed as a rate per 100 category 1 Medicare consultations.
- The rate of prescribing per 100 Medicare consultations is shown for the financial years 2016–17, 2017–18 and 2018–19.
- Numbers of prescriptions have been adjusted to represent a rate per 100 Medicare consultations to provide relative comparisons across years and to enable peer comparison with the median, 25th and 75th percentile of GPs in your RA. These data do not reflect absolute prescription counts or patient numbers.
- The purpose of this graph is to show you the trend in your rate of prescribing of opioids and how this trend compares to that of your peers.
I have an asterisk on my graph, what does this mean?
- This graph is scaled to fit rates of prescribing for 90% of all GPs in 2018–19.
- An asterisk on a column in the graph indicates that your rate of prescribing opioids, in that year, was higher than 90% of all GPs.
My data do not look as I’d expect, why could this be?
- If your opioid prescribing rate is higher than you expect, this may be because you have a low number of Medicare consultations.
For example, if you
- prescribed 60 opioid prescriptions for your patients that were dispensed in 2018–19
and
- claimed 500 category 1 Medicare consultations in your practice in 2018–19
then your rate of opioid prescriptions per 100 consultations = (60/500) *100 = 12.
- Similarly, if your opioid prescribing rate is lower than you expect, this may be because you have a high number of Medicare consultations.
For example, if you:
- prescribed 60 opioid prescriptions that were dispensed in 2018–19
and
- claimed 2000 category 1 Medicare consultations in your practice in 2018–19
then your rate of opioid prescriptions per 100 consultations = (60/2000) *100 = 3.
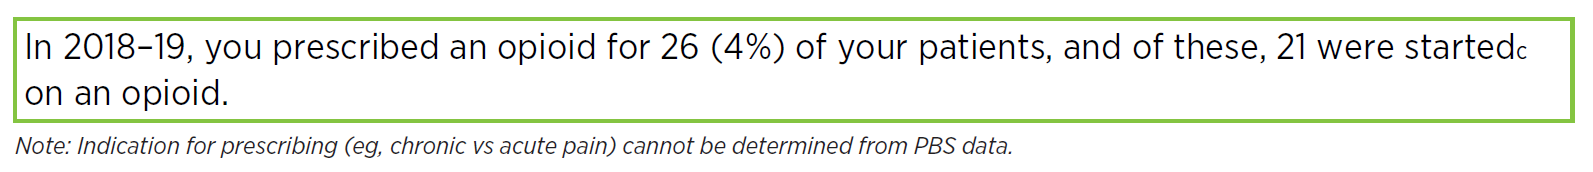
How many patients were prescribed an opioid in 2018–19?
What does this information show me?
- This information shows:
- the total number of patients (and percentage of all your patients) for whom you prescribed an opioid that was dispensed in 2018–19
- the total number of patients you started on an opioid in 2018–19. - A patient is considered to have started an opioid if
- they were prescribed an opioid by you that was dispensed in 2018–19
and
- they had not had any opioid prescribed by you dispensed in the previous 3 months. - The purpose of this information is to provide you with a snapshot of your prescribing of opioids in 2018–19 and allow reflection on initiation and longer-term use.
My numbers do not look as I’d expect, why could this be?
- Some of the patients included here as ‘starting treatment’ may be patients continuing an opioid initiated by another provider, or patients resuming treatment after a break of 3 months or longer.
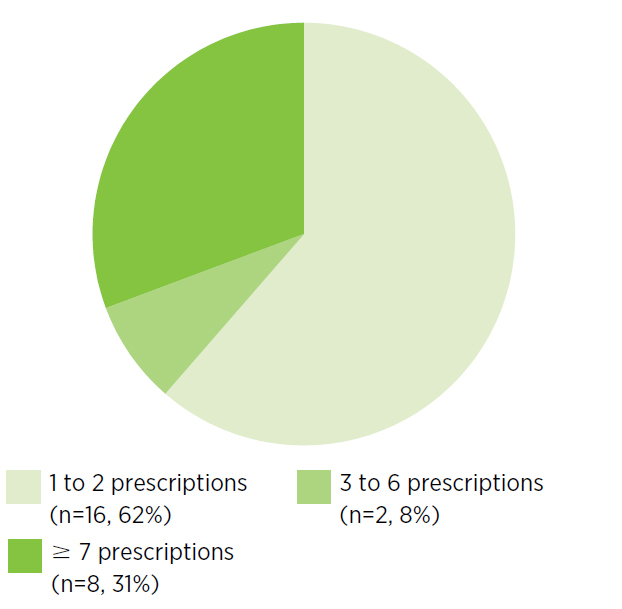
How many patients had 7 or more opioid prescriptions from you in 2018–19?
Read an accessible text version of this pie chart
What does this pie chart show me?
- This pie chart shows the number of patients who had
- 1 to 2
- 3 to 6
- 7 or more opioid prescriptions from you that were dispensed in 2018–19.
This is also expressed as a percentage of the total number of patients who were prescribed an opioid by you that was dispensed in 2018–19. - Due to rounding, percentages may not total 100%.
- The purpose of this chart is to indicate how long your patients remain on opioids based on your prescribing in 2018–19.
My numbers do not look as I’d expect, why could this be?
- The indication for prescribing (eg, acute vs chronic pain) cannot be determined from the PBS data. Opioids prescribed for patients with acute pain, for example, will increase the relative size of the 1–2 prescriptions section. Keep this in mind when using these data to reflect on duration of treatment for your patients with chronic non-cancer pain.
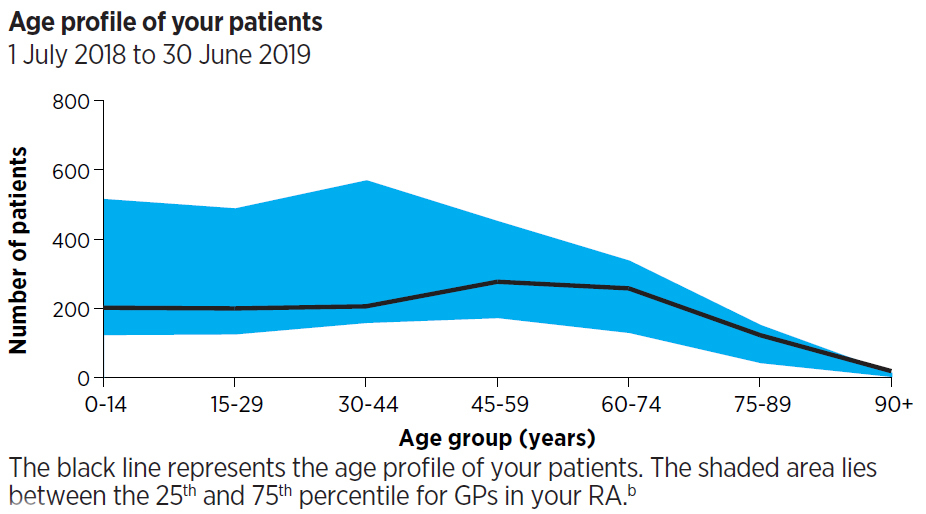
Age profile of your patients
Read an accessible text version of this graph
What does this graph show?
- This graph shows the breakdown by age group of all your patients who received a category 1 Medicare consultation between 1 July 2018 and 30 June 2019.
- The purpose of this graph is to give you a snapshot of your patient age profile to help you interpret your data.
- The shaded blue area lies between the 25th and 75th percentiles for the age profiles of patients of GPs in your RA.
- Your RA peer group is identified.
I have an asterisk on my graph. What does this mean?
- This graph is scaled to fit patient age profile data for 90% of all GPs.
- An asterisk on the age profile graph indicates that you have more patients within that age range than 90% of GPs.
Your Medicare patients and concession card holders
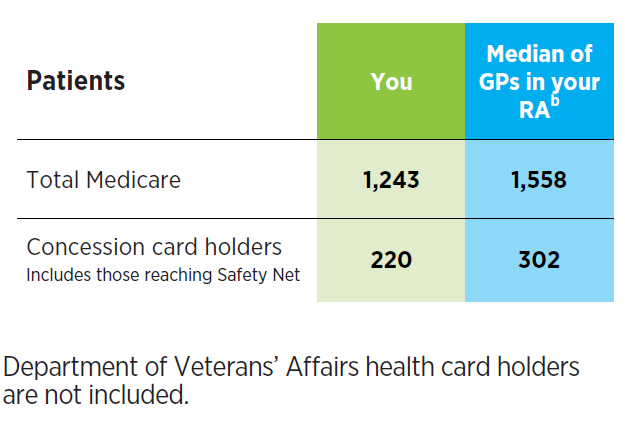
Read an accessible version of this table
What does this table show?
- This table shows the total number of unique patients that you saw for category 1 Medicare consultations in 2018–19 and the total number of unique patients who used concession cards (including those reaching safety net) to have prescriptions dispensed that were prescribed by you.
- The purpose of this table is to provide you with a snapshot of your patients to help you interpret your data.
- The median for GPs in your RA is also provided.
Frequently asked questions
I would like to know more
- Find out more about our national program: Opioids, chronic pain and the bigger picture and access a range of clinical tools and patient resources as well as CPD activities.
- Book an educational visit.
- Review your patients and your practice in our Clinical e-Audit which includes a tapering algorithm.
- Read the MedicineWise News: If not opioids, then what?