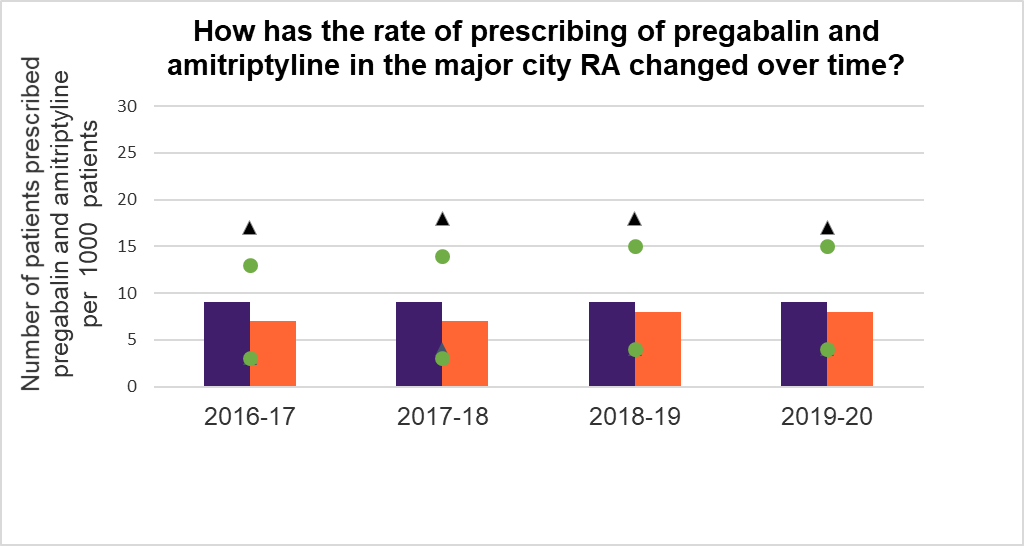
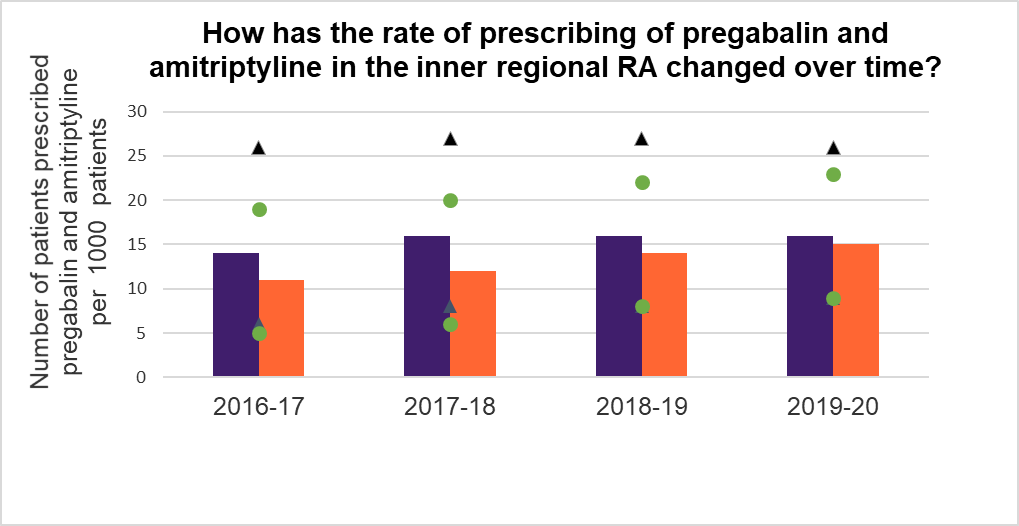
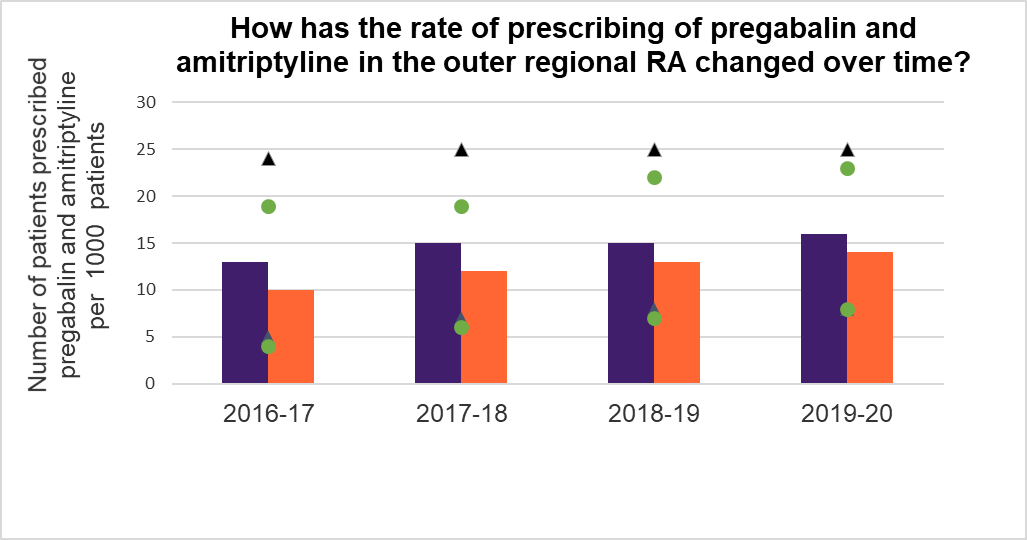
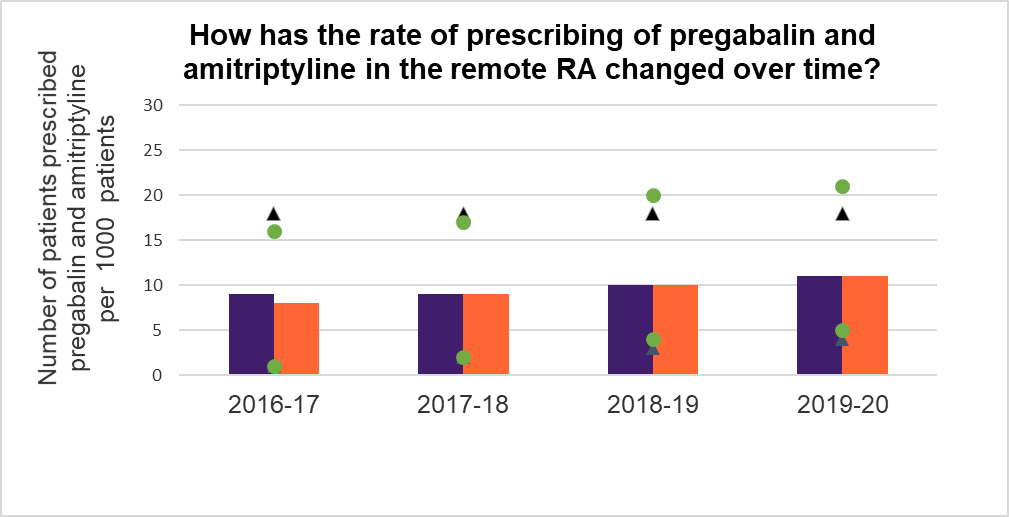
Pregabalin Practice Review – Data for remoteness areas over time
These graphs show the rates of pregabalin and amitriptyline prescribing for the median GP across various RAs over time.
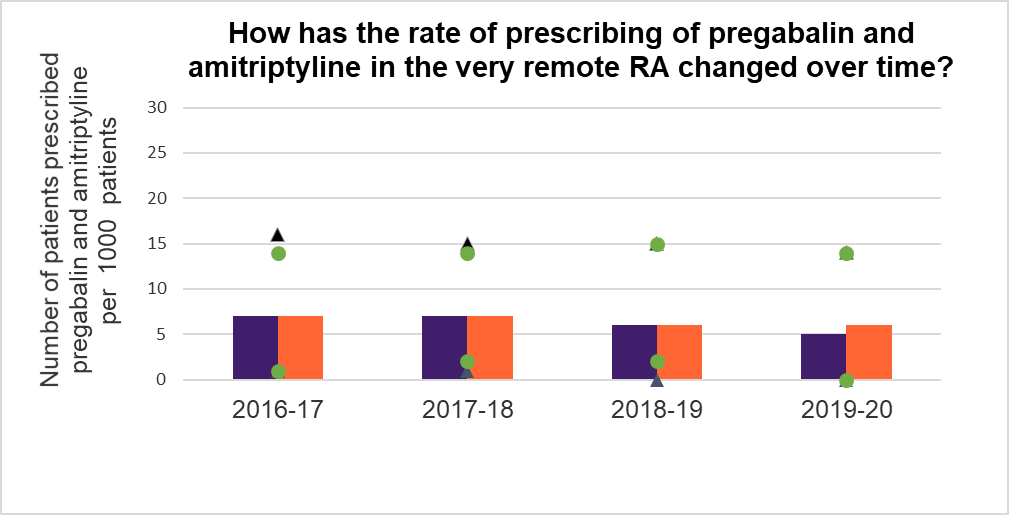
The following graphs show the rate of pregabalin (purple) and amitriptyline (orange) prescribing for the median GP across various RAs. The rate is expressed as number of unique patients prescribed pregabalin and/or amitriptyline, per 1000 unique patients that had a Medicare category 1 consultation with that GP in that RA in the corresponding financial year. The rate of prescribing of pregabalin (black triangles) and amitriptyline (green circles) for the 25th and 75th percentile prescriber is also shown.
Read an accessible text version of this data