Practice Review – Low back pain: communication is key
The graphs and tables on this webpage come from a sample report. The information on this page may help you interpret your individual feedback report if you have received one. You can find points for reflection in your individual report if you have received one, or in the sample report.

Key points
- Reflect on your practice and your requests for imaging of the low back
- Reflect on your data in relation to your patients and their indications for imaging
- Access a sample report
About the Practice Review
The Practice Review is a four-page report regularly mailed to GPs in Australia. Its purpose is to support you in your professional development and quality improvement. Each report focuses on a specific clinical area and includes:
- Background information about the clinical area of focus.
- Your individual utilisation of MBS tests or dispensing data for PBS medicines.
- Evidence-based points for reflection.
- Aggregate data of GPs working in similar practices across Australia for comparison.
- Additional data from the MedicineInsight general practice database (where available), to provide insights into the condition/s for which medicines or tests have been requested; this provides context to help you further interpret your data.
Download and print a sample report
Accessibility: this report is currently not 'AA' accessible. If you need help to access the report, please contact us on: +61 2 8217 8700 or [email protected].
Has your lumbosacral imaging requests changed over time?
In the financial year 2020–21, you requested 4 (X-rays) lumbosacral X-rays and 22 (CT scans) lumbosacral CT scans for your patients.
My data do not look as I’d expect, why could this be?
Data represents lumbosacral X-rays and CT scans that you requested and that were performed. If your numbers are lower than you expect, it may be:
- You are requesting lumbosacral images, but your patients are not having them performed.
If your numbers are higher than you expect, it may be:
- You requested lumbosacral images before the financial year 2020–21, but your patients had them performed during the financial year 2020–21.
Help me reflect on my data
- What approach do you take when deciding whether to refer a patient with low back pain for imaging?
- Of my patients who received a lumbosacral image, how many had one or more red flags that made me suspect a potentially serious spinal pathology?
- How do you discuss the harms of imaging with your patients/ carers?
What do these graphs show me?
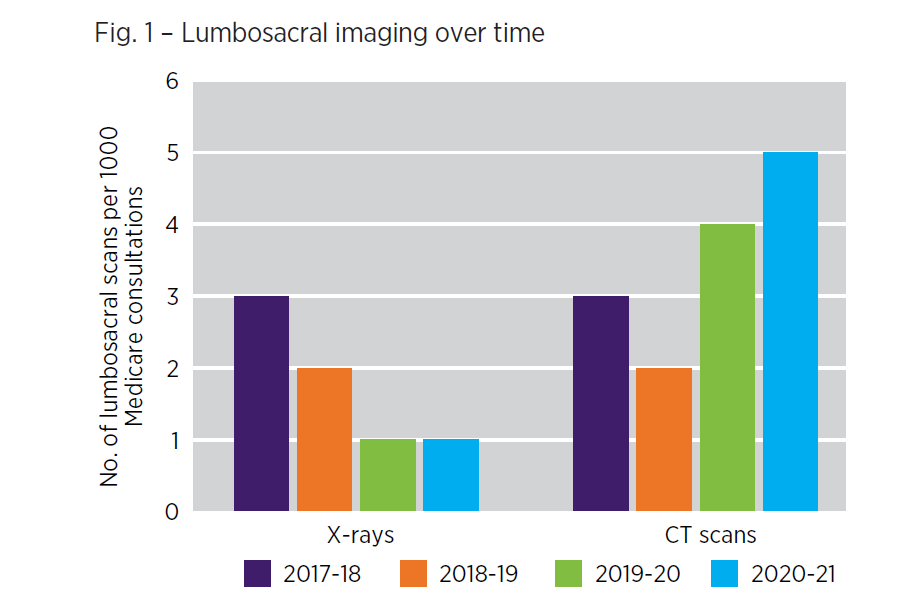
- Figure 1 shows the total number of lumbosacral X-rays and CT scans that you requested and that were performed, expressed as a rate per 1000 Medicare consultations.
- The request rate per 1000 Medicare consultations is shown for financial years 2017–18, 2018–19, 2019–20, 2020–21.
- The purpose of this graph is to show you the trend in your requests for different imaging modalities of the low back over time.
I have an asterisk on my graph, what does this mean?
- An asterisk on a column in the graph indicates that your data for that year are above the range that can be represented in the graph.
- This graph is scaled to fit 90% of the data from all GPs.
My data do not look as I’d expect, why could this be?
- If your requests for lumbosacral X-rays or CT scans are higher than you expect, this may be because:
- Your total number of Medicare consultations is lower than average.
For example, if you- Requested 5 lumbosacral X-rays in 2020–21.
- Have 500 Medicare consultations recorded in total for that financial year
then the rate of your lumbosacral X-rays per 1000 patients (green bar) = (5/500) * 1000 = 10.
- You requested an X-ray or CT scan prior to the financial year 2020-21, but your patients had them performed during the financial year 2020–21.
If your requests for lumbosacral X-rays or CT scan are lower than you expect, this may be because:
- Your total number of Medicare consultations is higher than average.
For example, if you:- Requested 6 lumbosacral X-rays in 2020–21.Have 2000 Medicare consultations recorded in total for that financial year then the rate of your lumbosacral X-rays per 1000 patients (green bar) = (6/2000) * 1000 = 3.
- You are requesting X-rays and/or CT scans, but your patients are not having them performed.
Help me reflect on my data
- Have my requests for lumbosacral imaging changed over the last 4 years?
- What are the reasons my imaging requests may have changed?
- How do you actively involve your patients in low back pain management?
- How do you provide patients/ cares reassurance that imaging is not required?
Which age groups did you request a lumbosacral image for in 2020-21?
What does this graph show me?
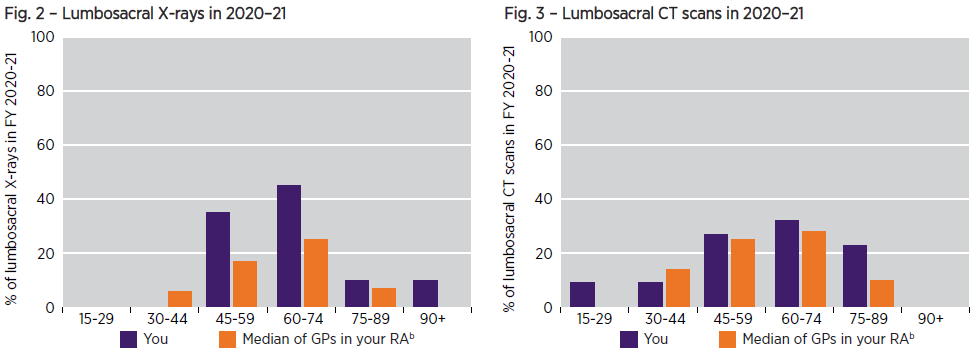
- This graph shows the age distribution of your patients who received an image of their lower back in the financial year 2020–21 compared to the median group of GPs in your RA.
- Data is shown for the age groups 15–29 years, 30–44 years, 45–59 years, 60–74, 75-89 and 90+ years.
- The number of patients in each age group is shown as a percentage of all patients who received a lumbosacral X-ray or CT scan in financial year 2020-21.
- The purpose of this graph is to provide you with more data about your patients who received a lumbosacral X-ray or CT scan in 2020–21 and show how your imaging requests compare to your peers.
Help me interpret and reflect on my data
- What is my overall patient demographic (eg, older or younger patients)? Does this impact the number of people I see with low back pain?
- When do I consider referring a patient with low back pain for imaging?
- How do I discuss a diagnosis of non-specific low back pain with my patients?
Age profile of patients in your practice
What does this graph show?
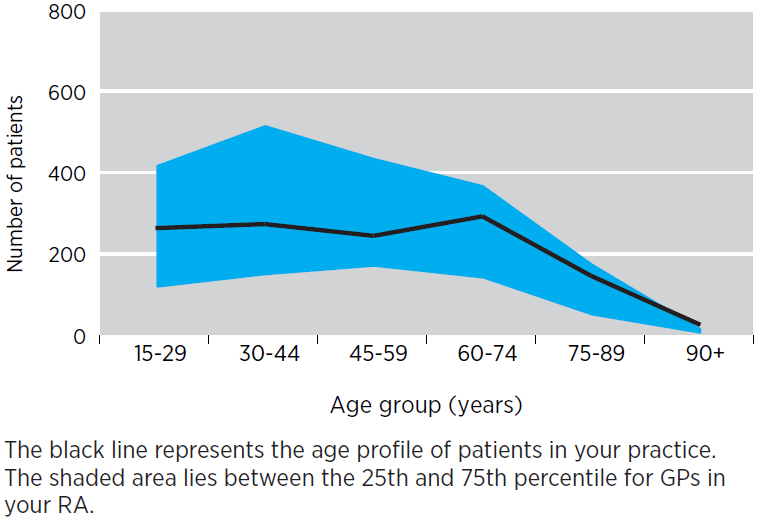
- This graph shows the breakdown by age group of the total number of your patients who received a category 1 Medicare benefit between 1 July 2020 and 30 June 2021.
- The purpose of this graph is to assist you interpret your imaging referral data by comparing the age profile of your patients to GPs in your RA.
- The black line represents the age profile of patients in your practice.
- The shaded blue area lies between the 25th and 75th percentile for the age profiles of patients of GPs in your RA.
- Your RA peer group is identified.
I have an asterisk on my graph. What does this mean?
- An asterisk on the age profile graph indicates that your data is above the range that can be represented in the graph, i.e. you have more than 800 patients in the age group above which the asterisk has been placed.
- This graph is scaled to fit 90% of the data from all GPs.
Your Medicare patients and concession card holders
What does this table show?
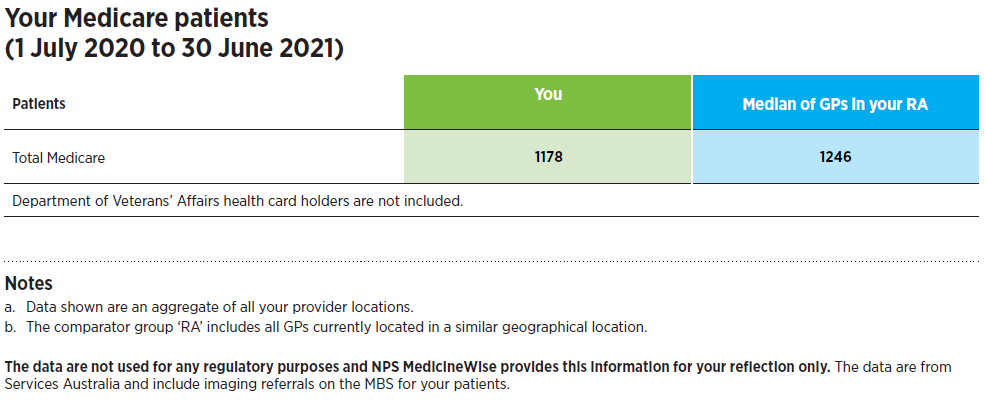
- This table shows the total number of unique patients aged 15 and above that you have seen for category 1 Medicare consultations between 1 July 2020 and 30 June 2021..
- The median for GPs in your RA is also provided.
National RA data
The following graphs show the rate of lumbosacral CT scans and X-ray requests from the median GP across various RAs. The rate is expressed as number of lumbosacral scans ordered per 1000 Medicare category one consultations for patients aged 15 and above.
How have lumbosacral image requests in the major city RA changed over time?
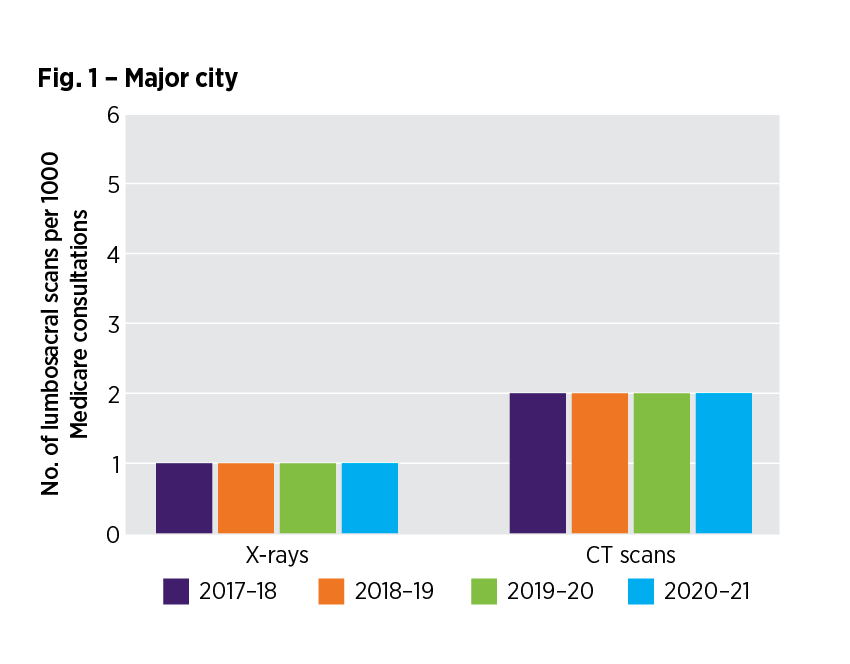
Read accessible version of the RA - figure 1
How have lumbosacral image requests in the inner regional RA changed over time?
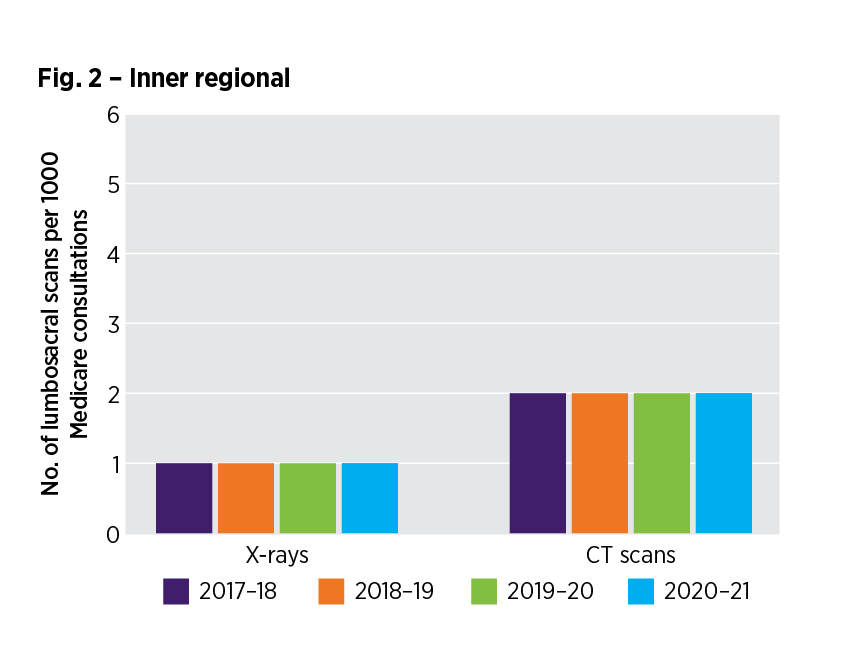
Read accessible version of the RA - figure 2
How have lumbosacral image requests in the outer regional RA changed over time?
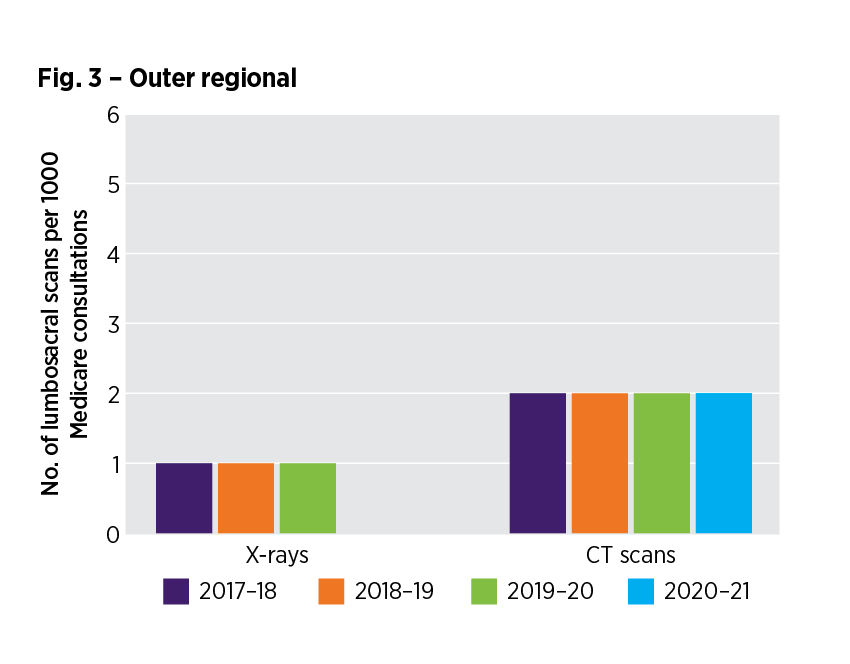
Read accessible version of the RA - figure 3
How have lumbosacral image requests in the remote RA changed over time?
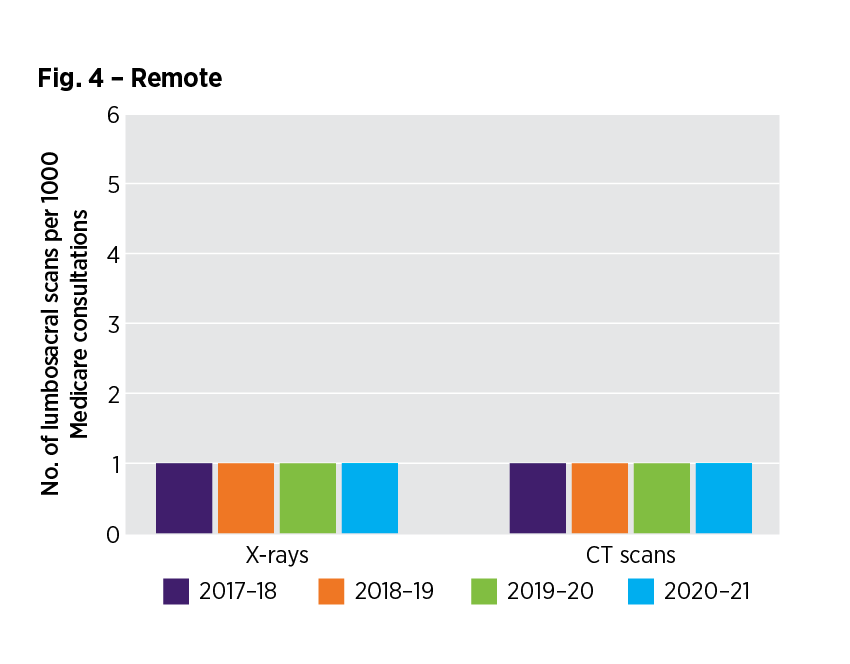
Read accessible version of the RA - figure 4
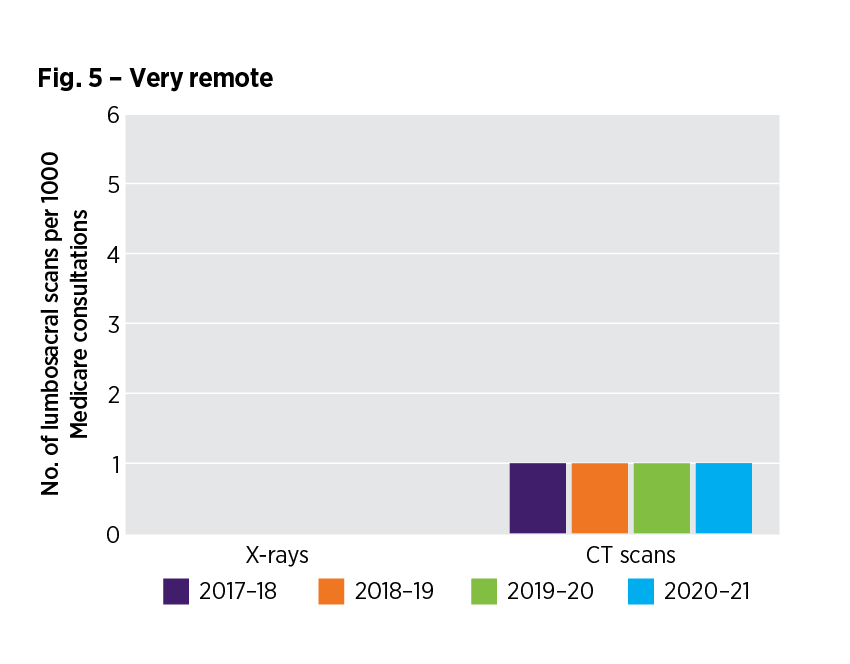
How have lumbosacral image requests in the very remote RA changed over time?
Frequently asked questions
I would like to know more
- Find out more about our national program and access a range of CPD activities and patient resources
- Read the MedicineWise News: Patient-centred, pragmatic prescribing for acute non-specific low back pain
- Access the case study: Taking action for acute low back pain
- Download a ‘Low back pain recovery plan’ for your patients.
- Provide the ‘Low back pain – do you need a scan?’ to patients and carers.
More questions? Want to give feedback?
Send us an email at [email protected] or call (02) 8217 8700
References
- Bardin LD, et al. Med J Aust 2017;206:268–73.
- Almeida M, et al. Med J Aust 2018;208:272–5.
- Maher C, et al. Lancet 2017;389:736–47.
- Lim YZ, et al. J Physiother 2019;65:124–35.
- Hoffmann TC, et al. BMC Fam Pract 2013;14:7.
- Hall AM, et al. BMJ 2021;372:n291.
- Therapeutic Guidelines:Rheumatology, Version 3. Melbourne: Therapeutic Guidelines Ltd, 2017.
- Slade SC, et al. Clin J Pain 2016;32:800–16.
- Braeuninger-Weimer K, et al. Eur J Pain 2019;23:1464–74.