Accessible text and data for figures in MedicineWise News: CKD – Integrating kidney health into patient care
Accessible data and description of figures relating to integrating kidney health into patient care.
Figure 1a (left): Causes of CKD in all Australian adults with kidney failure
Figure 1a is a pie chart that illustrates the causes of CKD among all Australian adults older than 18 years with kidney failure. The causes are 38% diabetes, 27% other, 12% hypertension,18% glomerulonephritis, 5% polycystic disease.
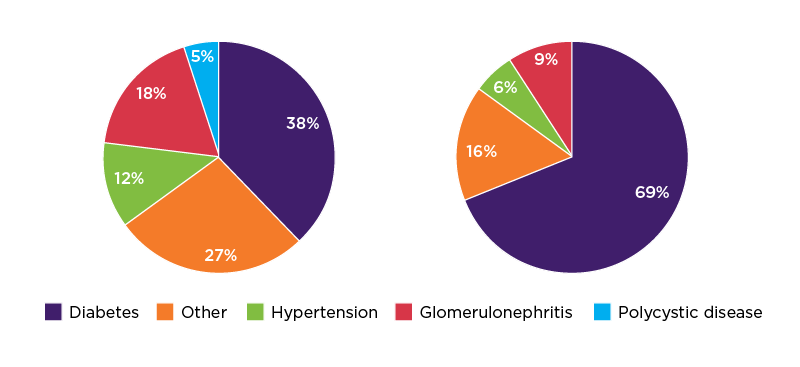
Figure 1b (right): Causes of CKD in Aboriginal and Torres Strait Islander adults with kidney failure
Figure 1b is a pie chart that illustrates the causes of CKD in Aboriginal and Torres Strait Islander adults with kidney failure. The causes are 69% diabetes, 16% other, 6% hypertension, 9% glomerulonephritis.
This data comes from Australian and New Zealand Dialysis and Transplant Registry. ANZDATA 44th Annual Report 2020. Adelaide: Australia and New Zealand Dialysis and Transplant Registry, 2020 (accessed 15 May 2022).Return to MedicineWise News
Figure 2: CKD and diabetes prevalence rates among Australian adults
Figure 2 is a bar graph that shows the prevalence rates of chronic kidney disease (CKD) and diabetes among all Australian adults older than 18 years.
The prevalence rate for diabetes is 5.4%. The prevalence rate for CKD is 10%.
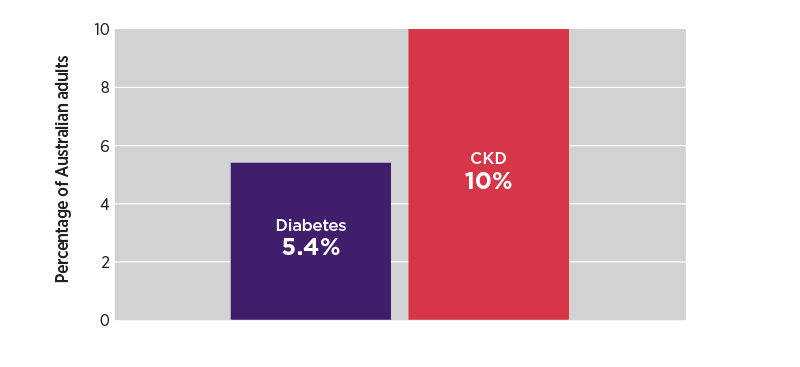
Figure 3: Kidney Health Check
Figure 3 is an infographic illustrating the three components of a Kidney Health Check.
1. A blood test to check for estimated glomerular filtration rate (eGFR) calculated from serum creatinine.
2. A urine test to check for albumin / creatinine ratio (ACR) for albuminuria.
3. A blood pressure check.
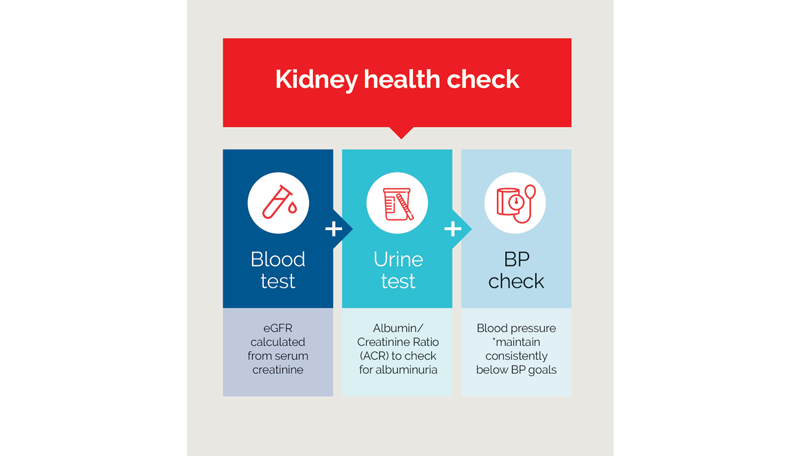
BP = blood pressure; eGFR = estimated glomerular filtration rate
This data comes from: Kidney Health Australia. Chronic kidney disease (CKD) management in primary care. Melbourne: Kidney Health Australia, 2020 (accessed 5 January 2022).
Return to MedicineWise News
Figure 4: Diagnostic algorithm for CKD
Figure 4 is a flow chart showing the steps for making a diagnosis of chronic kidney disease (CKD).
It starts with identifying patients with risk factors.
The next step is to screen those at risk of probable CKD by doing a Kidney Health Check.
The next step is doing a series of estimated glomerular filtration rate (eGFR) checks testing for kidney function and urine albumin/creatinine ratio (ACR) testing for albuminuria.
This includes eGFR testing to exclude acute kidney injury as the cause of rapid eGFR decline.
The next step, if CKD is confirmed is to use the eGFR and/or the ACR testing results to determine stage of kidney function and albuminuria by mapping on a colour-coded table.
The next step is to complete guideline recommended investigations to help determine the underlying cause of CKD.
The next step is combining the eGFR stage, albuminuria stage and cause to complete the CKD diagnosis.
The last step is using the colour-coded staging to guide the management plan.
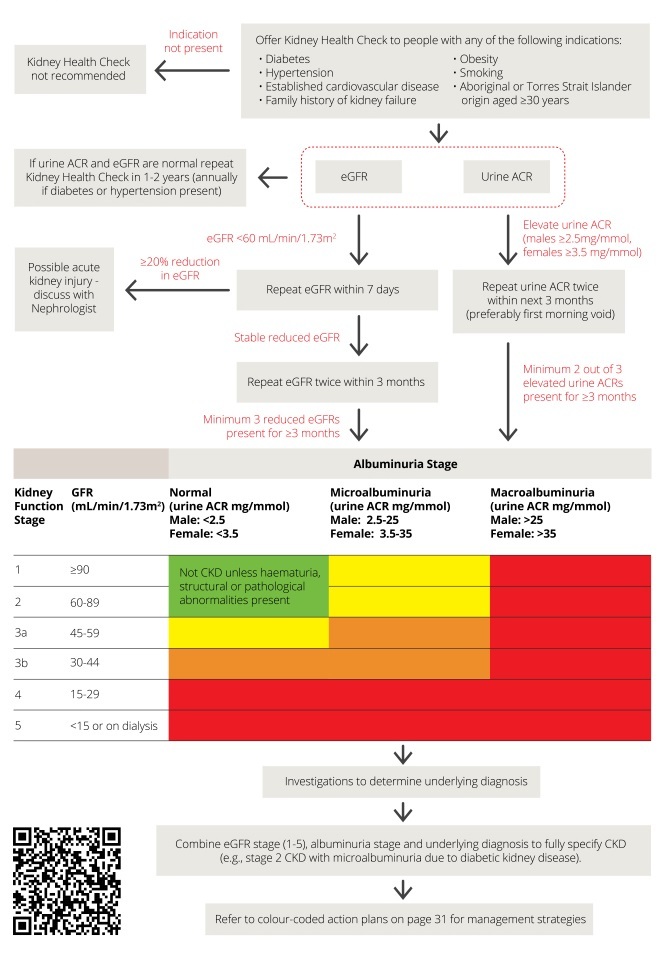
This data comes from: Kidney Health Australia. Chronic kidney disease (CKD) management in primary care. Melbourne: Kidney Health Australia, 2020 (accessed 5 January 2022).
Figure 5: Three components for recording a diagnosis of CKD
Figure 5 is an infographic showing the three components of recording a diagnosis of CKD.
1. Estimated glomerular filtration rate (eGFR) result to determine CKD Stage (1-5)
2. Urine albumin/creatinine ratio (ACR) result to determine stage of albuminuria (normo, micro or macro).
3. Underlying pathology to determine cause of CKD.
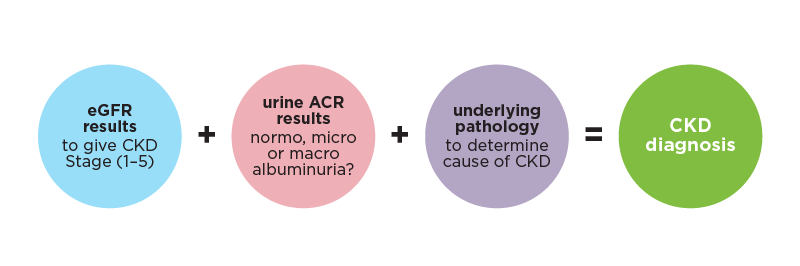
ACR = albumin/creatinine ratio; CKD = chronic kidney disease; eGFR = estimated glomerular filtration rate
Return to MedicineWise News
Figure 6: Staging of CKD and colour-coded risk levels that guide clinical action plans for management
Figure 6 is a colour-coded staging table for kidney function and albuminuria.
Kidney function stage is listed in descending order based on eGFR, down the left side of the table from 1 to 5.
Albuminuria stage based is listed in ascending amount across the top of the table from normo, micro to macro.
The colours are the risk level for CKD progression and cardiovascular events.
Green colour is low risk, yellow is moderate risk, orange is high risk, red is very high risk.
The colour-coded risk levels guide clinical action plans for management.
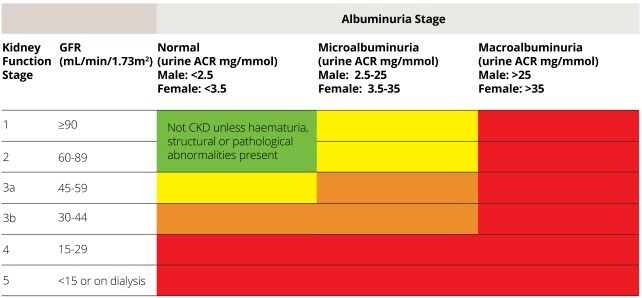
Risk level colour codes; green = low risk, yellow = moderate risk, orange = high risk and red = very high risk.
Source: KHA-CARI Guideline: Early chronic kidney disease: Detection, prevention and management. Johnson DW, Atai E, Chan M, et al. Nephrology 2013;18:340–50. Wiley Online Library.
Return to MedicineWise News