Practice Review – Managing lipids: statins revisited
Australian GPs recently received a Practice Review on prescribing of statins. Find out more about how to read your practice review.
Key points
- Reflect on your practice and prescription patterns of statins and ezetimibe.
- Find more information to help you interpret and understand your data.
- Review and download a sample report.
- Read the following in relation to your individual report.
About the Practice Review
The Practice Review is a four-page report regularly mailed to GPs in Australia. Each report focuses on a specific clinical area and includes:
- background information around the clinical area of focus
- your individual dispensing data for PBS medicines or utilisation of MBS tests
- aggregate data of GPs working in similar practices across Australia for comparison
- additional insights from the MedicineInsight general practice database to help you interpret your graphs in the context of your own clinical practice
- points of reflection to support you in your professional development and quality improvement by providing you with an opportunity to reflect on your current practice.
The information on this page is provided to help you interpret your data. Read this information alongside your individual report.
Download a sample report
How has your prescribing of ezetimibe changed over time?
There are approximately 38,000 new patients starting ezetimibe each year in Australia. In general, most ezetimibe use is ezetimibe added to a statin.1
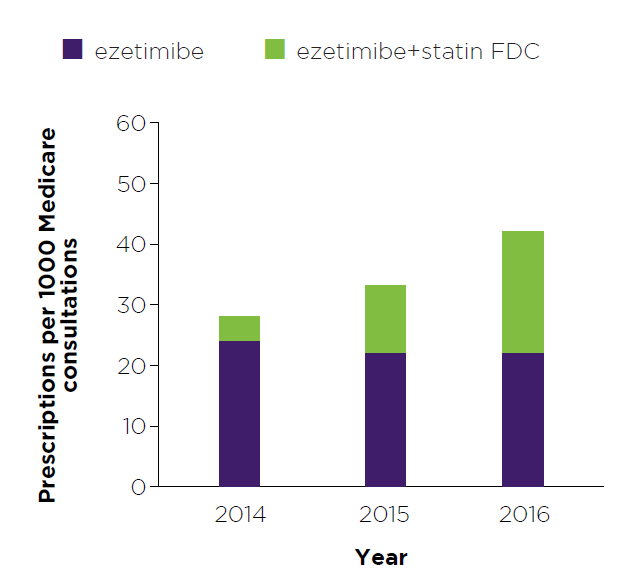
Figure 1: Read an accessible version of this graph
What does this graph show me?
- This graph shows the number of prescriptions for ezetimibe that you wrote and that were dispensed, expressed as a rate per 1000 Medicare consultations. The ‘rate of prescribing per 1000 Medicare consultations’ is shown for 2014, 2015 and 2016.
- Numbers have been adjusted to represent a rate per 1000 Medicare consultations to provide relative comparisons across years. They do not reflect actual prescription counts or patient numbers.
- The purpose of this graph is to show the trend in your prescribing of ezetimibe over time.
My numbers are higher than I’d expect, what does this mean?
- You may have a low number of Medicare consultations in that year. In this case, low prescription numbers will appear larger as they need to be scaled up to represent a rate per 1000 Medicare consultations.
- For example, in 2016 if you submitted 250 Medicare consultation claims, from which 20 prescriptions of ezetimibe were written by you and dispensed, then you would see 80 prescriptions per 1000 Medicare consultations. However, if you submitted 500 Medicare consultations claims, from which the same number (20) prescriptions for ezetimibe were written and dispensed, your rate of prescribing would be 40 per 1000 Medicare consultations.
- Try dividing your rate of prescribing by 10 to calculate your prescriptions of ezetimibe as a percentage of all your Medicare consultations to help you put your rate of prescribing into perspective.
- Your patient demographics may influence the expected results. Use the age profile graph on the last page of the report to help you to put your data into clinical perspective. For example, many of your patients may be older or younger than the average of the GPs you are being compared with.
- Consider this data in relation to your patients, their CV risk, treatment history, adverse events and target lipid levels.
I have an asterisk on my graph, what does this mean?
- One asterisk on a column in the graph indicates that your data for one medicine is above the range that can be represented in the graph. Two asterisks on a column in the graph indicates that the data for both medicines (ezetimibe and ezetimibe+statin FDC) are above the range that can be represented in the graph.
- Graphs are scaled to fit 95% of the data from all GPs.
My numbers are lower than I’d expect, what does this mean?
- You may have high numbers of Medicare consultations in that year. In this case, prescription numbers will look smaller as they need to be scaled down to represent a rate per 1000 Medicare consultations.
- For example, in 2016 if you have 3600 Medicare consultations, in which 4 prescriptions of ezetimibe were prescribed, then you would see 1 prescription per 1000 Medicare consultations.
- Your patients may not be getting the prescriptions you wrote for them actually dispensed.
How adherent are your patients to statin treatment?
Non-adherence to medicines is common in patients with chronic disease, especially those prescribed preventative medicines.
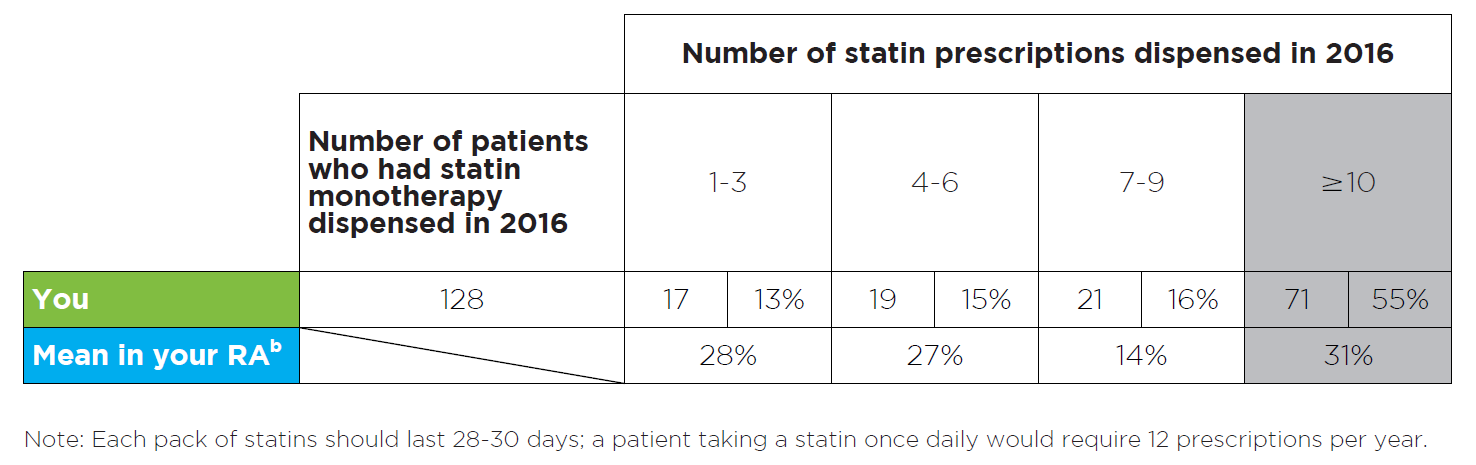
Figure 2: Read an accessible version of this table
What does this table show?
- This table shows the number of your patients who were using statin treatment (and no other lipid-modifying medicine), and how many statin prescriptions they had dispensed, in 2016.
- The number of patients who had each specific number of statin prescriptions dispensed is also expressed as a percentage of all patients on statin monotherapy.
- The purpose of this table is to provide you with a snapshot of your patients’ possible adherence to statin treatment.
- Remoteness Area (RA) is a geographical categorisation. There are 5 RAs: major city, inner regional, outer regional, remote and very remote. Comparisons are made between all GPs in the same RA.
- RA data is also provided for comparison to your peers. Here, the total number of patients who had 1–3, 4–6, 7–9 or ≥ 10 prescriptions dispensed is expressed as a percentage of the total number of patients using statin monotherapy in your RA.
My numbers do not look the way I’d expect, why could this be?
You will probably have a mix of patients who:
- are using ongoing, once-daily statin treatment and would usually require ≥ 10 prescriptions per year – ie, the majority of your patients
- started statin treatment in 2016 and may have fewer statin prescriptions dispensed depending on their starting date – ie, a small group of your patients
- are using alternate day doses and may require fewer statins prescriptions in a year
- are not getting their statin prescriptions dispensed.
Consider this data in relation to the mix of patients in your practice.
What intensity of statin treatment do you prescribe?
Maximising the dose of the statin helps maximise cardiovascular benefits. LDL-C reduction of 1 mmol/L reduces the risk of vascular events by 21%.2
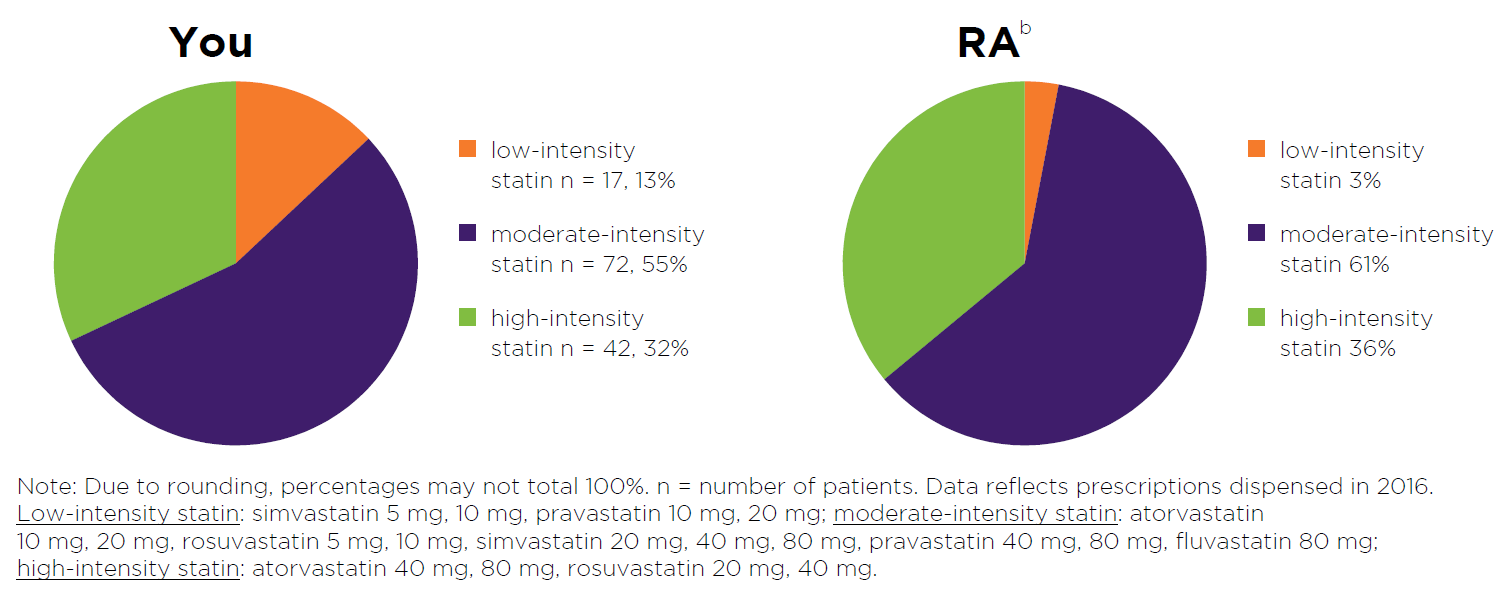
Figure 3: Read an accessible version of this pie chart
What does this graph show?
- This graph shows the number of your patients who had a low-, moderate- or high- intensity statin dispensed in 2016.
- Patient numbers are also expressed as a percentage of all your patients using statin treatment.
- Detail from the most recent prescription dispensed to the patient is captured in the graph.
- The purpose of this graph is to provide you with a snapshot of the spread of statin intensities your patients are currently using.
- RA data is provided for comparison to your peers. Here, the total number of patients using low-, moderate- or high-intensity statin is expressed as a percentage of the total number of patients using statin treatment in your RA.
- Consider this data in relation to your patients, their target lipid levels, treatment history and adverse events.
How many of your patients started ezetimibe due to a clinically important adverse event with a statin?
Statins have been associated with a nocebo effect, whereby patients experience adverse effects based on their expectation of harm from a treatment.
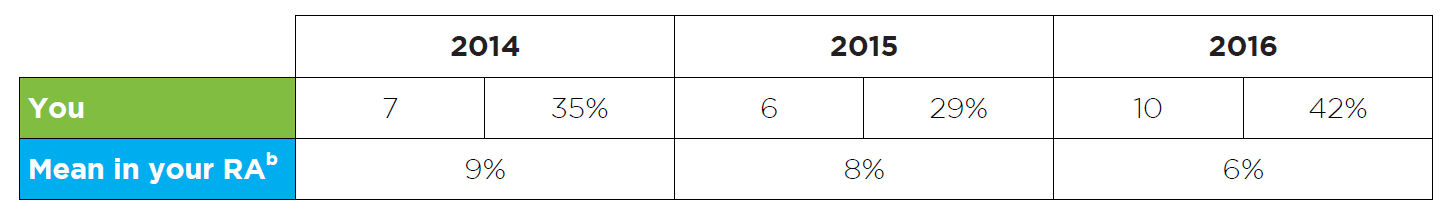
Figure 4: Read an accessible version of this table
What does this table show?
- This table shows how many of your patients received ezetimibe following a clinically important adverse event with a statin in 2014, 2015 and 2016.
- Patient numbers are also expressed as a percentage of all patients using ezetimibe treatment.
- The purpose of this table is to provide a snapshot of your patients who experienced a clinically important adverse event with a statin and subsequently required ezetimibe treatment.
- RA data is also provided for comparison to your peers. Here, the total number of patients who were supplied ezetimibe due to a clinically important adverse event with a statin, is expressed as percentage of all patients using ezetimibe treatment in your RA in 2014, 2015 and 2016.
My numbers do not look the way I'd expect, why could this be?
- Consider these data in relation to your patients, the steps you take to manage statin-associated adverse effects such as muscle symptoms, and the authority codes you use when writing prescriptions.
- Learn more about how to manage patients who present with muscle symptoms while using statins, before adding or switching to ezetimibe. See the NPS MedicineWise SAMS Assessment Guide and Management Algorithm.
Age profile of your patients
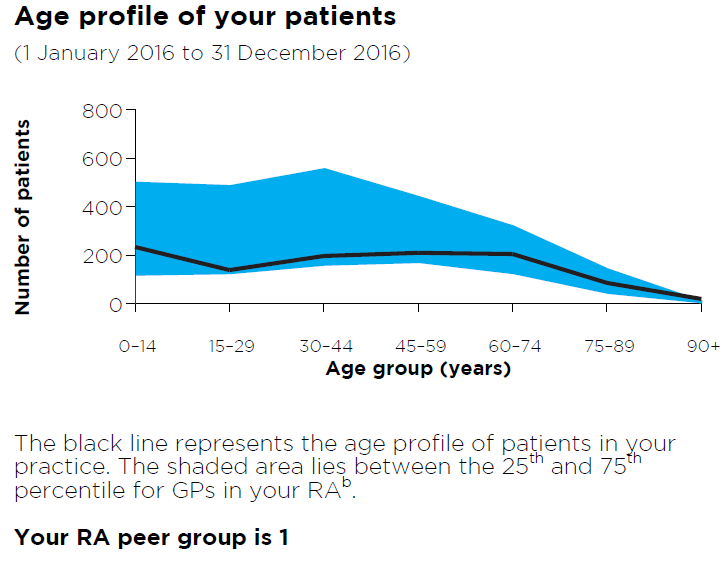
Figure 5: Read an accessible version of this graph
What does this graph show?
- This graph shows the breakdown by age group of your total number of patients who received a category 1 Medicare consultation between 1 January 2016 and 31 December 2016.
- The purpose of this graph is to give you a snapshot of your patients to help you interpret your data.
- The shaded blue area lies between the 25th and 75th percentile for the age profiles of patients of GP practices in your RA.
- A reference to your RA peer group is made.
I have an asterisk on my graph. What does this mean?
An asterisk on the age profile graph indicates that your data is above the range that can be represented in the graph, ie, you have more than 800 patients in the age group above which the asterisk has been placed.
Your Medicare patients and concession card holders
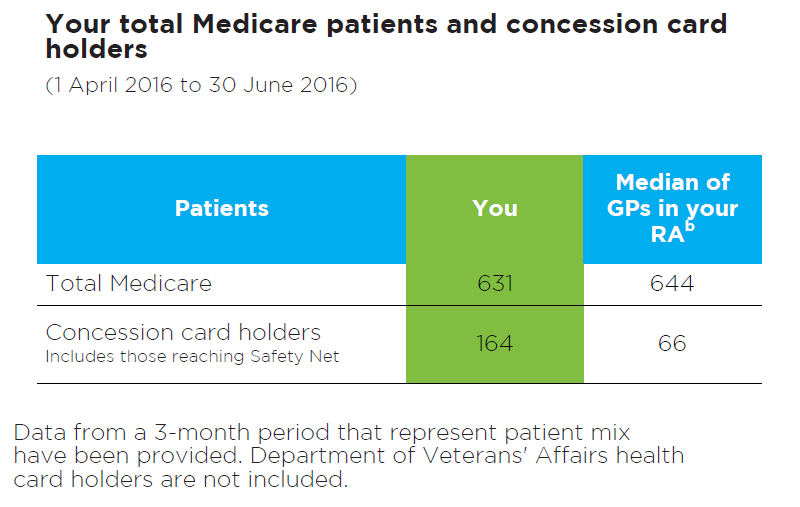
Figure 6: Read an accessible version of this table
What does this table show?
- This table shows the total number of unique patients that you have seen over a standard 3-month period.
- The total number of patients who received a category 1 Medicare consultation, and the total number of patients who used a concession card or safety net card to dispense a prescription written by you, is shown.
- The purpose of this table is to provide you with a snapshot of your patients to help you interpret some of the data presented in the graphs and tables in this report.
- This information is from 1 April 2016 to 30 June 2016
- The median for GPs in your RA is also provided.
Frequently asked questions
Notes
a. Data shown are an aggregate of all your provider locations.
b. The comparator group ‘RA’ includes all general practitioners currently located in a similar geographical location (ie, 1. major city, 2. inner regional, 3. outer regional, 4. remote, 5. very remote).
c. Aggregate MedicineInsight data on 1 August 2017
d. Includes ezetimibe products with an approved indication for statin-related clinically important adverse events as per the following authority codes: 5562/3731 (ezetimibe 10 mg); 4353 (atorvastatin 10 mg + ezetimibe 10 mg); 4147 (rosuvastatin 10 mg + ezetimibe 10 mg; simvastatin 10 mg + ezetimibe 10 mg; simvastatin 20 mg + ezetimibe 10 mg).
e. According to PBS criteria, clinically important adverse event is defined as severe myalgia (muscle symptoms without creatine kinase elevation); myositis (clinically important creatine kinase elevation with or without muscle symptoms) or unexplained, persistent elevations of serum transaminases during statin treatment.
I would like to know more
- Find out more about our national program: Managing lipids, and access a range of clinical tools and patients resources as well as CPD activities
- Read the MedicineWise News: Uncovering the truth about statin intolerance
- Complete our online Case study – Optimising statin therapy
- Review your patients and your practice in our Clinical e-Audit – Statins: who, when and how?
- Review the NPS MedicineWise SAMS Assessment Guide and Management Algorithm
More questions? Want to give feedback?
Send us an email at [email protected] or call 02 8217 8700.
References
- Cardiovascular Expert Group Therapeutic Guidelines. Therapeutic Guidelines: Cardiovascular. West Melbourne: Therapeutic Guidelines Ltd, 2012 (accessed 21 February 2017).
- Law MR, Wald NJ, Rudnicka AR. Quantifying effect of statins on low density lipoprotein cholesterol, ischaemic heart disease, and stroke: systematic review and meta-analysis. BMJ 2003;326:1423.
- Pandor A, Ara RM, Tumur I, et al. Ezetimibe monotherapy for cholesterol lowering in 2,722 people: systematic review and meta-analysis of randomized controlled trials. J Intern Med 2009;265:568-80.
- Turin A, Pandit J, Stone NJ. Statins and nonadherence: should we relate better? J Cardiovasc Pharmacol Ther 2015;20:447-56.
- Chowdhury R, Khan H, Heydon E, et al. Adherence to cardiovascular therapy: a meta-analysis of prevalence and clinical consequences. Eur Heart J 2013;34:2940-8.
- Thompson PD, Panza G, Zaleski A, et al. Statin-associated side effects. J Am Coll Cardiol 2016;67:2395-410.
- Stroes ES, Thompson PD, Corsini A, et al. Statin-associated muscle symptoms: impact on statin therapy-European Atherosclerosis Society Consensus Panel Statement on Assessment, Aetiology and Management. Eur Heart J 2015;36:1012-22.
- Rosenson RS, Baker SK, Jacobson TA, et al. An assessment by the statin muscle safety task force: 2014 update. J Clin Lipidol 2014;8:S58-71.
- National Vascular Disease Prevention Alliance. Guidelines for the management of absolute cardiovascular disease risk. 2012 (accessed 21 February 2017).
- Drug Utilisation Sub-Committee (DUSC). Ezetimibe with simvastatin utilisation analysis: public release document, October 2014. Canberra: Department of Health, 2014 (accessed 3 August 2017).
- National Cancer Institute. Maximum tolerated dose. NCI dictionary of cancer terms. National Institutes of Health, 2017 (accessed 31 January 2017).
- Boekholdt SM, Hovingh GK, Mora S, et al. Very low levels of atherogenic lipoproteins and the risk for cardiovascular events: a meta-analysis of statin trials. J Am Coll Cardiol 2014;64:485-94.
- Deichmann RE, Morledge MD, Ulep R, et al. A Metaanalysis of interventions to improve adherence to lipid-lowering medication. Ochsner J 2016;16:230-7.
- Casula M, Tragni E, Catapano AL. Adherence to lipid-lowering treatment: the patient perspective. Patient Prefer Adherence 2012;6:805-14.
- Chew DP, Scott IA, Cullen L, et al. National Heart Foundation of Australia & Cardiac Society of Australia and New Zealand: Australian clinical guidelines for the management of acute coronary Syndromes 2016. Heart Lung Circ 2016;25:895-951.
- Australian Medicines Handbook. Australian Medicines Handbook [Cardiovascular drugs]. Adelaide: AMH Pty Ltd, 2016 (accessed 24 July 2017).
- NPS MedicineWise. SAMS Assessment Guide. 2017 (accessed 24 July 2017).
- Zhang H, Plutzky J, Skentzos S, et al. Discontinuation of statins in routine care settings: a cohort study. Ann Intern Med 2013;158:526-34. https://www.ncbi.nlm.nih.gov/pubmed/23546564.